


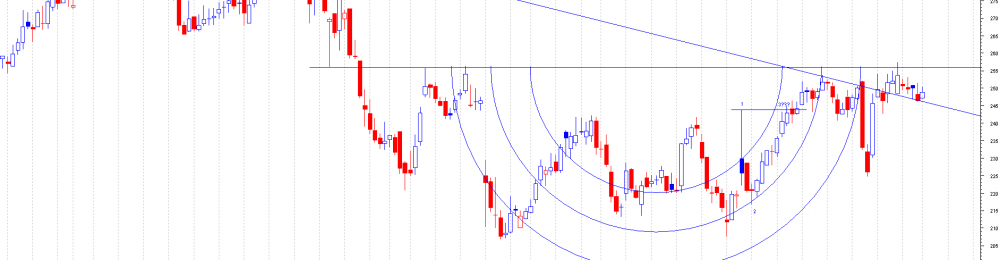
Despite the markets' current bearishness and the concern over the US budget and debt ceiling, I think the S&P is worth a long at this uptrend support with stops below it.This support comes from the Nov 2012 low and has played an important role since then, coming into play on at least 4 previous occasions. IMHO this is the support for Primary wave 3 so if this wave is to continue it will need to hold; if it fails then it will likely mean that Primary 3 is over and we're into Primary 4 which should be a long, volatile and unpredictable sideways drop.The level in play here is 1664 so that's where I'll have an order with stops below 1660 Original link...
Continue reading

ChartsView Blog:
- Subscribe to this category
- Subscribe via RSS
- 252 posts in this category

This is an update of the shares that that have been tipped since 2nd september to 20th October in the Premium section called "Share Tips". It's been very profitable netting in excess of 1500 points from the combined shares tipped.
This blog is going to be done like the previous blogs where it will show you the before picture and after pictures of the shares. This is the best way to show this, as its easy to follow and as many know I don't do hindsight trading like many so called pros out there. This blog will show this. I will put the dates on the companies tipped so that members can check when the tips were done so that you know it's the real deal. Like I have said there is no hindsight trading. It's all done by pure charting, here goes.
2nd September 2013
BALF.L
Before: This is the Chart...
Continue reading

End Illegal Extension of the average speed cameras on the A13
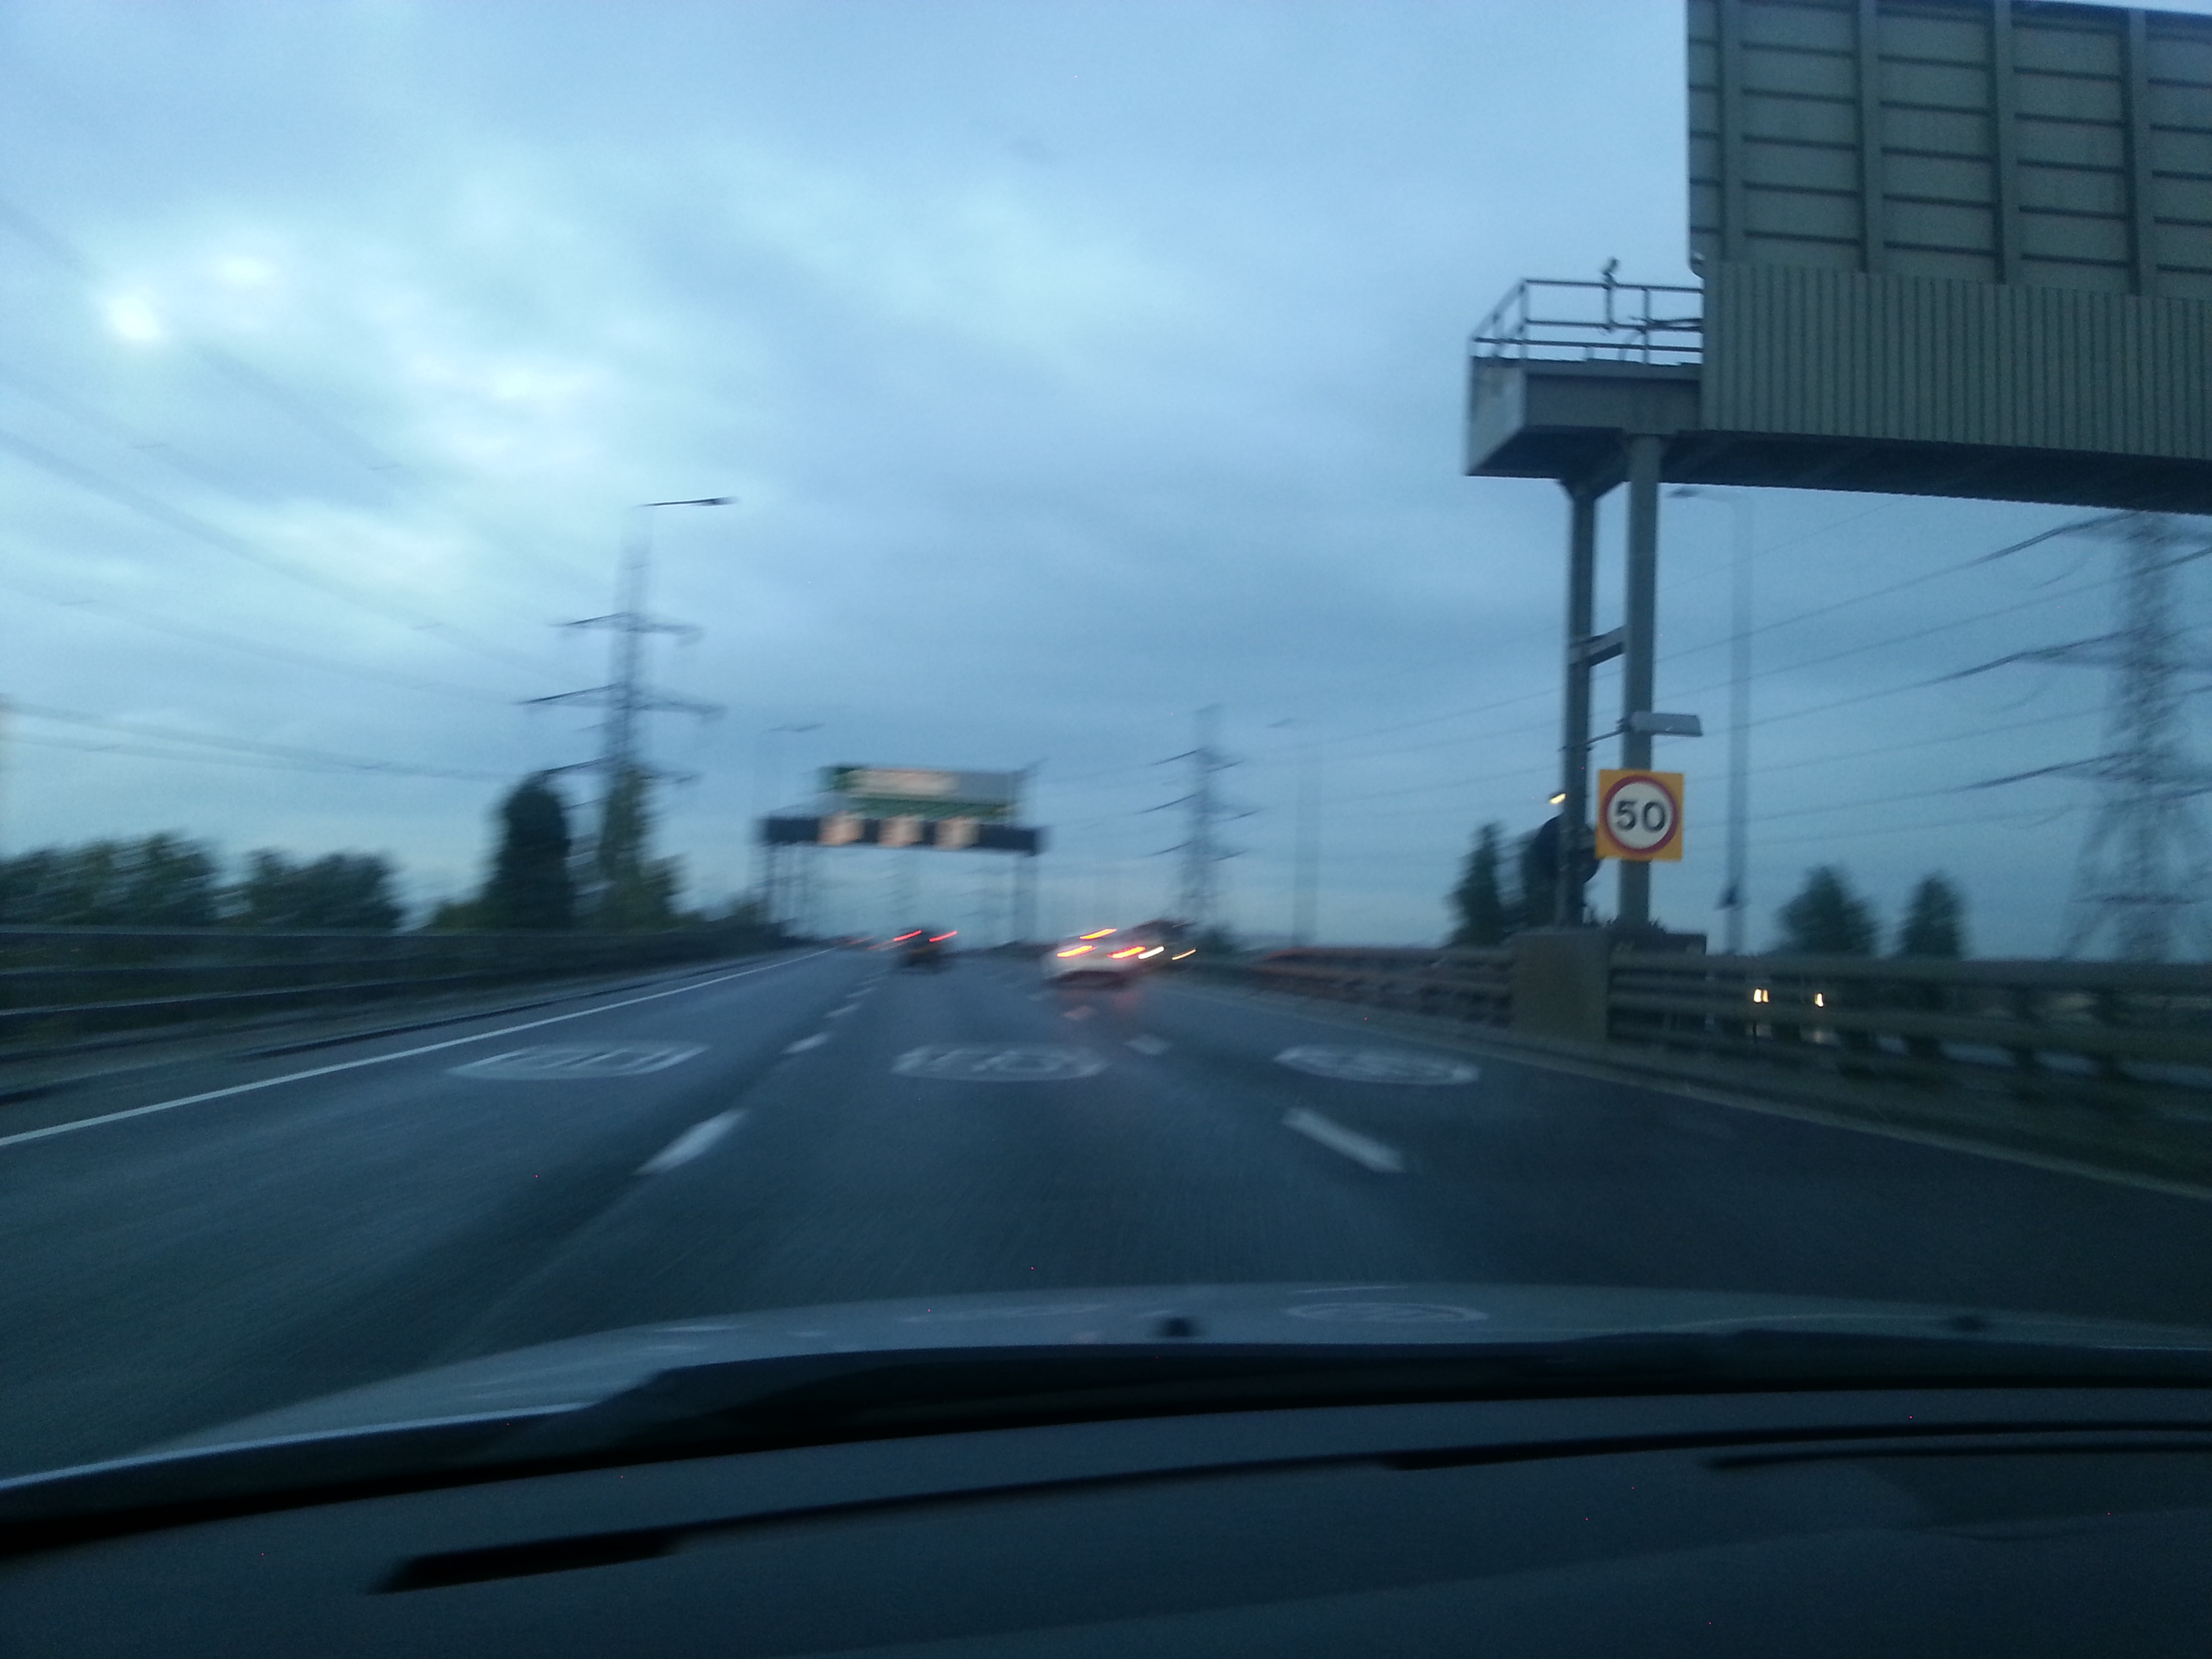
I am calling on the government to help British motorists by removing the average speed restrictions extension on the A13 Tms Gway/Kent Av to A13 by Scrat Terr IG11 W/B, United Kingdom. This extension is a speed trap for innocent motorists because it's been put on the section of the A13 where there is a national speed of 70MPH, which suddenly becomes 50MPH for the average speed cameras. There are no signs leading up to the average speed camera starting point from the M25 to the A13 Tms Gway/Kent Av. The signs start from there itself therefore causing motorists to slam on their breaks, which is very dangerous and can cause accidents.
The image below shows the first sign post warning of the speed camera and just ahead you can see the speed camera.Thats a good 4-5 miles from the...
Continue reading
As expected, 203p acted as support for the retrace from 240p and an inside bar formed on Friday which broke to the upside convincingly today with a marubozu and a gap up which is strongly suggestive of further rises tomorrow and beyond IMHO.Despite the recent high at 240p, it's my belief that a close above 230p will be enough to bring on a test of the next resistance at 260p where there could be some profit-taking. If there isn't and the SP closes above that key level (remember, it's the highest the SP has been since the drop from 465p to 141p) then it should open up the possibility of a gap close at 337/9p.We need to consider the wave count here too; it's my view that 240p to 203p has formed either a 4th wave or possibly the 4th subwave of the 3rd wave up (no way of knowing)...
Continue reading

Depending on your view, the gap stands at either 193p (the high of the previous day - ignore the big green candle low) or at 187.75p which was the close of the previous day. I prefer the latter for determining stops.In addition, we have the breakout point at 189.75p, the uptrend support which will be at 183.5p today (Fri), the 50% Fib of the 129-240 move at 184.5p, the 50% Fib of 126-240 at 183.2p and the doji from 6th Sept at 184p. Pick you own from that bunch but I'd have a stop below the trendline in case it goes.If the trendline does break then I'd look to 171p as the 61% Fib of the 126-240 move for a target for wave 2 down from 240p with a stop below 166p.Looking at RSI we can see that it's almost back at the main uptrend support which adds weight to...
Continue reading
