


There really hasn't been much going on in recent days to give us a clue towards future movement but, at last, we have something to watch for - today's inside bar.An inside bar is when the entire day's trading range is contained within the previous day's range. Some technicians go further and even require the inside bar's range to be within the candle body of the previous day but in my view that's not necessary.The point about an inside bar is that it represents indecision. There aren't enough buyers to break the previous day's high nor enough sellers to break the previous day's low. This gives us an opportunity since we know the market is looking for the same signal as us ie direction.[Another way to view inside bars is that on smaller timeframes they're also triangles - usually of the symmetrical type - and we also know to trade...
Continue reading
-
1 Hour Trading System - Day 1
Trading Systems Trading systems have been used all over the world for centuries, why are they so popular you may ask? Well it's because of the many benefits the trading systems provide such as providing entry and exit points, taking the emotion out
-
Share Tips from 4th November-1st December 2013
This blog is an update from the share tips from 4th November to 1st December 2013 from the Premium Section called Share Tips.There was a possible 2000+ points profit to have been made.This obviously assumes the max possible and some of these shares h

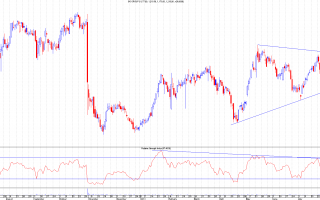
There's been a triple whammy of RSI breakouts today which is a very bullish signal and price usually follows. Here we see the weekly chart but this, of course, could yet reverse and close inside as there's still Friday to come. I think it's unlike to do that for the following reasons.... The daily chart on the left shows a clear RSI breakout with price yet to reach its equivalent downtrend. In my experience this is usually an early signal that prices will follow.In addition, the inside bar mentioned in the previous blog entry has now broken and closed to the upside which is an added bullish signal. As we can see, the downtrend lies at 154p so that's the number to keep our eyes on tomorrow. Finally, here's the 4H chart which has been usually helpful recently in terms of RSI supports and resistance. Again, we have the RSI...
Continue reading

A Review The Gulf Keystone chart has become very interesting now so I thought it might be useful to review it in depth and also to see which levels will be important in the coming week and why. It'll be a lengthy piece so please bear with me.We begin with the daily chart going back to the 260p high. This is where I believe wave C of the correction down from 450p started so it's good to look at the whole sequence from there because what we're trying to establish is whether it's complete or not.This wave C should consist of 5 subwaves or a typical "impulse" or "motive" wave. These have a textbook form whereby wave 2 retraces 61.8% of wave 1 and wave 4 retraces 38.2% of wave 3. This is exactly what happened here; the 228p high was very close to the 61.8% Fib of the wave 1...
Continue reading

Previous support was bound to cause a bounce but news came to give it a boost. The key to this one now are those two levels - the 4.6/7p support and the 7.68p resistance.Look to the RSI to give an early clue for an upside breakout - if it breaks its trendline before the price does then price should follow. Then there's the 8.425p level to break.Either way, it's going to have to make a breakout in the coming weeks and room between the horizontal support and downtrend resistance has limited time left. Original link...
Continue reading

I've chosen to show this simple weekly chart of AFC as it clearly shows how the trendlines are providing good supports and resistance.The recent spike up to 52.05p exactly hit the resistance and without a close above that level it's unlikey that higher prices will follow.As can be seen, this share spikes around a lot with very quiet periods in between so it's clearly a very news affected share and therefore a bit unpredictable. Purely from a technical point of view, the 52p level should have been sold and I'd now be either short or waiting for either a Fib support (not shown) or the lower trendline for a long entry.I tend to stay away from shares like this for obvious reasons. Original link...
Continue reading
