


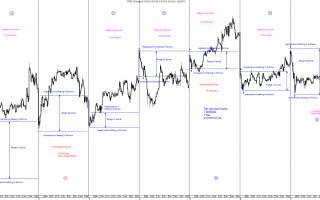
Since RSI has formed part of the discussion today I thought I'd post a chart showing those details (thanks to Gary for pointing out the RSI breakout backtest).The lowest RSI support goes all the way back to June 2007 where it was at its lowest value. Since then the 4.5p low formed a higher high and a bullish divergence. This same RSI support has come into play only twice since: once at the 87p low and just recently at the 126p low.The top RSI resistance comes from the bearish divergence from when the price made a peak of 320p and then the 450p high. Since then it was hit on the rise to 228p showing that that level was a good place to sell/short. There is another RSI resistance above this which comes from the 2009 131p high and the 450p peak but it's off the top of the chart.Finally...
Continue reading
-
1 Hour Trading System - Day 1
Trading Systems Trading systems have been used all over the world for centuries, why are they so popular you may ask? Well it's because of the many benefits the trading systems provide such as providing entry and exit points, taking the emotion out
-
Share Tips from 4th November-1st December 2013
This blog is an update from the share tips from 4th November to 1st December 2013 from the Premium Section called Share Tips.There was a possible 2000+ points profit to have been made.This obviously assumes the max possible and some of these shares h

Nice bounce off the intermediate uptrend support today which should form the bottom of wave 4 of the move up from Nov 2012.EWT has a guideline which says that a wave 4 should not go below the low of wave 4 of one lesser degree. That was at 14444 so this fits nicely. The trendline and 38.2% Fib (of the wave 3 move) came into play perfectly. Original link...
Continue reading

This chart is all the more interesting when we also consider the gold chart. What we appear to have is a hammer at the 78.6% Fib and the long term 123p support.In addition, despite the short term uptrend channel breaking down, the RSI uptrend remained intact. Further to that, in my experience, it's exactly this touch on the RSI uptrend formed from the bullish divergence (or bearish divergence in downtrend cases) which usually provides the best entry point.It'll be very interesting to see if this follows through next week after gold hit the medium term target of $1265 on Friday. Original link...
Continue reading

Here we can see how the short term uptrend support got heavily sold in Thursday's bear market but the interesting thing is that it bounced just above the $1265 support covered in the weekly chart from 27th May.This level ought to be at least a medium term low as there's a complete wave sequence down to this level and it was also the trading range target per the above post. There's an RSI bullish divergence to help and silver also hit it's main target of 1950 on Friday too. Original link...
Continue reading

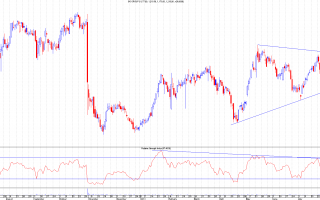
Almost a month on from the last post on silver and our target of $19.50 has been hit. The daily chart below shows the bullish RSI divergence and, perhaps more interestingly, how the RSI downtrend played a perfect role in providing sell/short points. The key thing to look for now is for that RSI to break out of it's downtrend. That ought to confirm a decent move upwards in price as long as it occurs before the price breaks out of it's downtrend (not shown). Note also that gold has also hit an important target level on Friday too. Original link...
Continue reading
