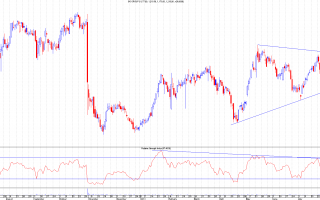
On this hourly chart we can see the bearish divergences mentioned by Gary in the comments from the previous post. This is when prices make new highs but indicators, such as the RSI and MACD histogram shown here, fail to make their own new highs.I've added a possibly wave count for interest.There's nothing so far in this chart or the price action I've seen to suggest a change is required to the last analysis so I'm still waiting to go long on a retrace at around the 141-143p area. Will I get it? Only time will tell.PS, have a look at the POG thread for a good example of a 123-low breakout - that's what we could get here if there's a retrace to that target area and then a break above whatever the current high turns out to be. These types of breakouts can be very powerful (again, see...
Continue reading
This has been a classic 123-low trade so far, even backtesting the 135p area first thing this morning (where I added to my longs as I opened a first tranche early in anticipation of this event).However, we can't be sure, yet, that this is the start of a new trend as it could simply be an ABC correction upwards and that's why I'll be closing half my position just below that first resistance at 154p. The idea will then be to see if that resistance holds and, if there is a retrace, project where it should stop if this is not a correction. I'll update this as we go - best not to presume too much at this early stage. Original link...
Continue reading
So far in today's trading GKP has made a marginal new high at 160p. There is what looks like an ascending triangle up from the 140.5p low following the initial breakout from 137.5p which seems to be breaking out into a 5th wave up from the 126p low.I'd like to see it reach the downtrend resistance at 165p (today) to be sure that this is a 5th wave up (and to take out that 161p level) and then I'll look to enter long on any retrace, preferably around the 50-61.8% area at 141-145p.For now, though, it's looking increasingly likely that 126p was the low. Let's not forget that there was a trendline support at that level from the 64p and 87p lows which we can see on the weekly chart below. Original link...
Continue reading
Vodaphone traded off a key level of 197.5p last week having closed above it. The backtest of the breakout failed and was followed by a gap down below the short term uptrend support and there's a long term bearish divergence in the daily RSI. The importance of this level can clearly be seen on this monthly chart and if it can break back above the 200.65p high from 22 May then it should go on to the next resistance at 231.75p.For now, though, I'd favour a short at the gap down from 196.4p as it offers a nice tight stop above the 200.65p high. If that stop gets taken out then the above scenarios would become favourite and it may be worth reversing my position. If it works out I'll be looking towards the 185p area to close as there's a gap there and the 38.2% Fib of the last...
Continue reading
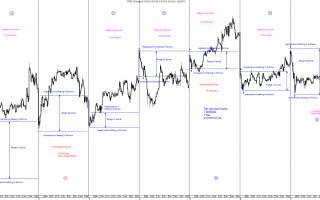
Spot gold looks to be in the final stages of its long correction from the $1921 top back in Sept 2011. At least, there's plenty of support just below the recent low and the wave count shown on this weekly chart (if correct - there are almost always alternative counts) supports the view that a trend change could be due.The black arrows are equal in length and show the target for the 1525 to 1800 trading range break. This comes in at the 1250 mark and there's a support from an earlier price high at 1265. Just above that we have the 50% retracement level at 1303 and a price support at 1307. I'd favour the latter 1300-1307 area as a good place for a low as there are two technical levels very close and the "round number" psychological level too. That would also complete a very tidy 5 wave...
Continue reading


