Apple is still in a clean uptrend, sitting just under its 23 October high of 351.73. Friday dipped to 334.35, right onto the 50 EMA, and buyers pushed it back to close at 344.63. The 50 EMA at 334.21 is the line the trend has to hold; a close above 351.73 would open fresh highs.
Daily Chart
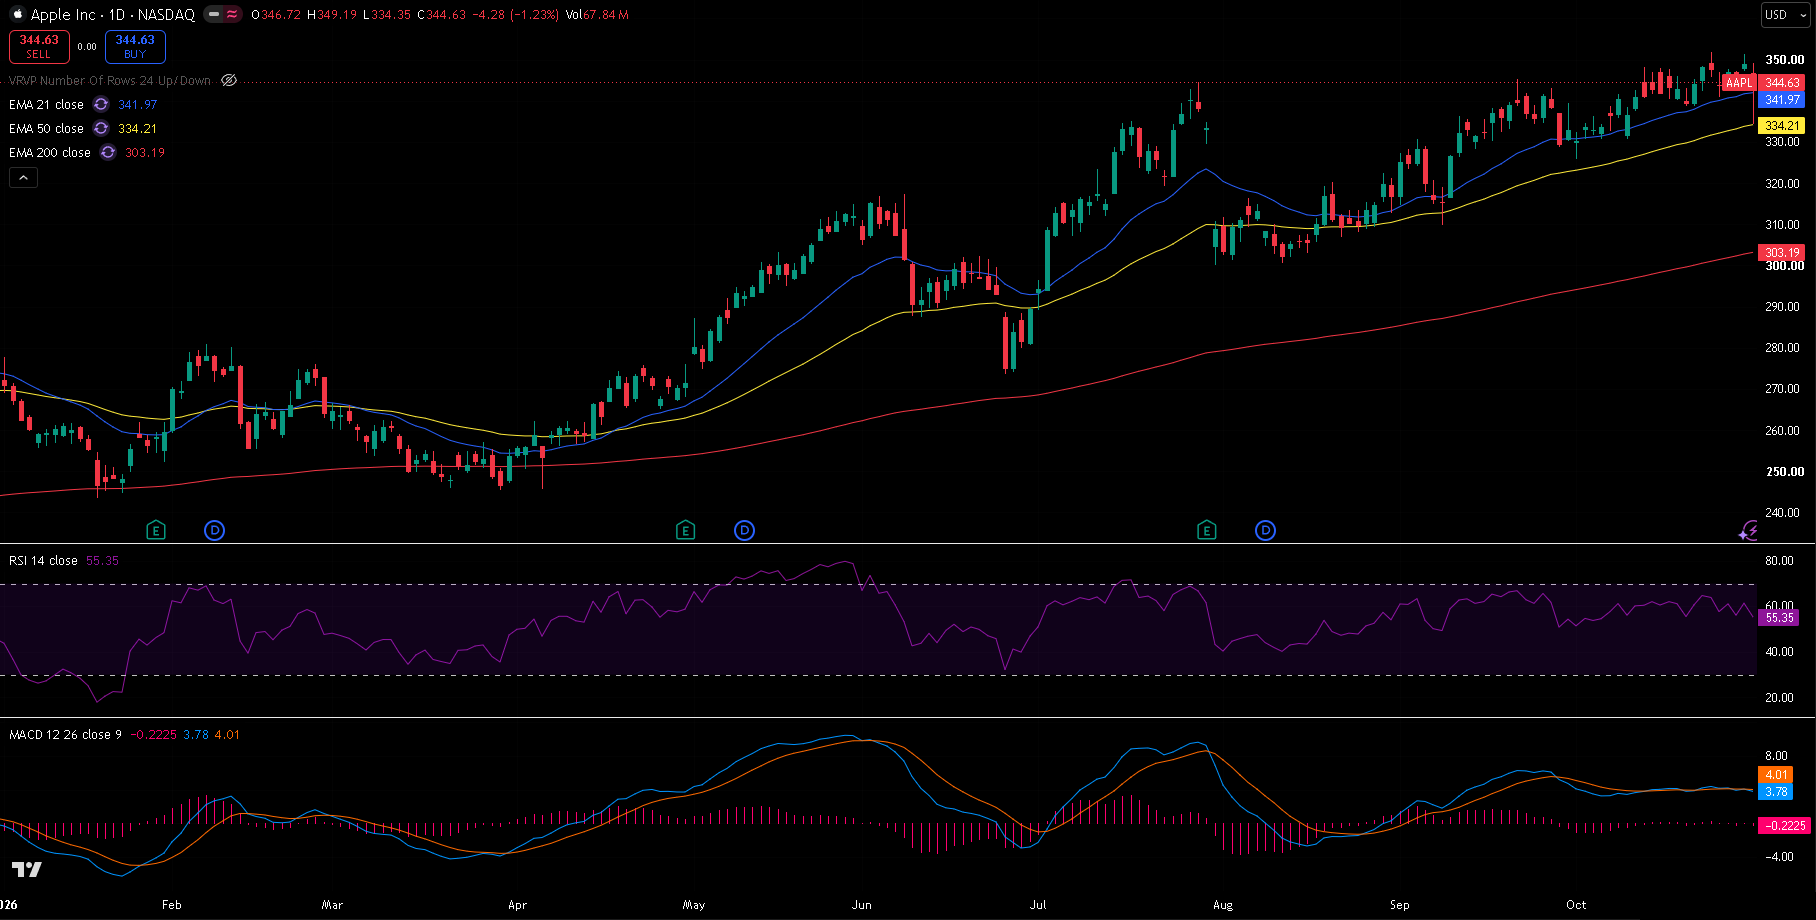
AAPL daily chart, 30 October 2026 close — 21/50/200 EMA, RSI(14) and MACD(12,26,9). Friday's long lower wick touched the 50 EMA and recovered most of the drop.
Trend and Structure
Apple has been making higher highs and higher lows since the spring: lows at 273.75 on 25 June, 309.90 on 9 September and 325.81 on 1 October, and highs at 344.57 on 29 July, 345.34 on 22 September and 351.73 on 23 October. The EMAs are stacked in the right order — 21 (341.97) above 50 (334.21) above 200 (303.19) — and all three are rising. The stock has been grinding sideways, mostly between about 338 and 352, since mid-October, which is a pause near the highs rather than a break in the trend.
Key Levels
The level that matters most is the 50 EMA at 334.21, tested and held on Friday. Above, 351.73 is the breakout level.
| Type | Level | Why it matters |
|---|---|---|
| Fib 127.2% | 363.11 | Extension of the September–October rally |
| Resistance | 351.73 | 23 October high, the 2026 high |
| Resistance | 348.15 | 13 October high |
| Resistance | 345.34 | 22 September high |
| Current | 344.63 | Last close |
| EMA 21 | 341.97 | Short-term trend; with the 23.6% level at 341.86 |
| Support | 338.70 | 20 October low, bottom of the recent range |
| Fib 38.2% | 335.75 | First meaningful retracement |
| EMA 50 | 334.21 | Medium-term trend; Friday's low was 334.35 |
| Fib 61.8% | 325.88 | Lines up with the 1 October low at 325.81 |
| Support | 309.90 | 9 September low, start of the latest leg up |
| EMA 200 | 303.19 | Long-term trend, well below |
Fibonacci levels are drawn from the 9 September low at 309.90 to the 23 October high at 351.73.
Momentum and Volume
RSI(14) is at 55.35, comfortably positive without being stretched. MACD is at 3.78 against a signal line of 4.01, a histogram of -0.22: both lines are above zero but have flattened out and just crossed, so upward momentum has stalled for now. Friday traded 67.8 million shares against a 20-day average of about 40.4 million — the heavier volume came on the dip to the 50 EMA, and most of it was bought back.
Bull Case
The 50 EMA keeps holding and price closes above 351.73. That breaks the October range and opens the 127.2% extension at 363.11 as the next measured target.
Bear Case
A daily close below the 50 EMA at 334.21 would be the first real crack in the trend since the summer. That opens the 1 October low and 61.8% level at 325.81–325.88, with the 9 September low at 309.90 below.
Trade Scenarios
| Direction | Trigger | Stop | Target |
|---|---|---|---|
| Long | Daily close above 351.73 | 337.00 | 363.11 |
| Short | Daily close below 334.21 | 349.00 | 325.81, then 309.90 |
Risk warning: Technical analysis reflects probability, not certainty. Levels are reference points, not signals. Capital at risk. This is educational content, not investment advice.