SpaceX fell 6.4% on Friday to 134.72, its lowest close since August, after losing the rising trendline from the 3 August low. Price has now given back more than half of the August–October rally. The 61.8% retracement at 132.18 is the next test; overhead, the 149 area is where the EMAs, the broken trendline and the 38.2% level all meet.
Daily Chart
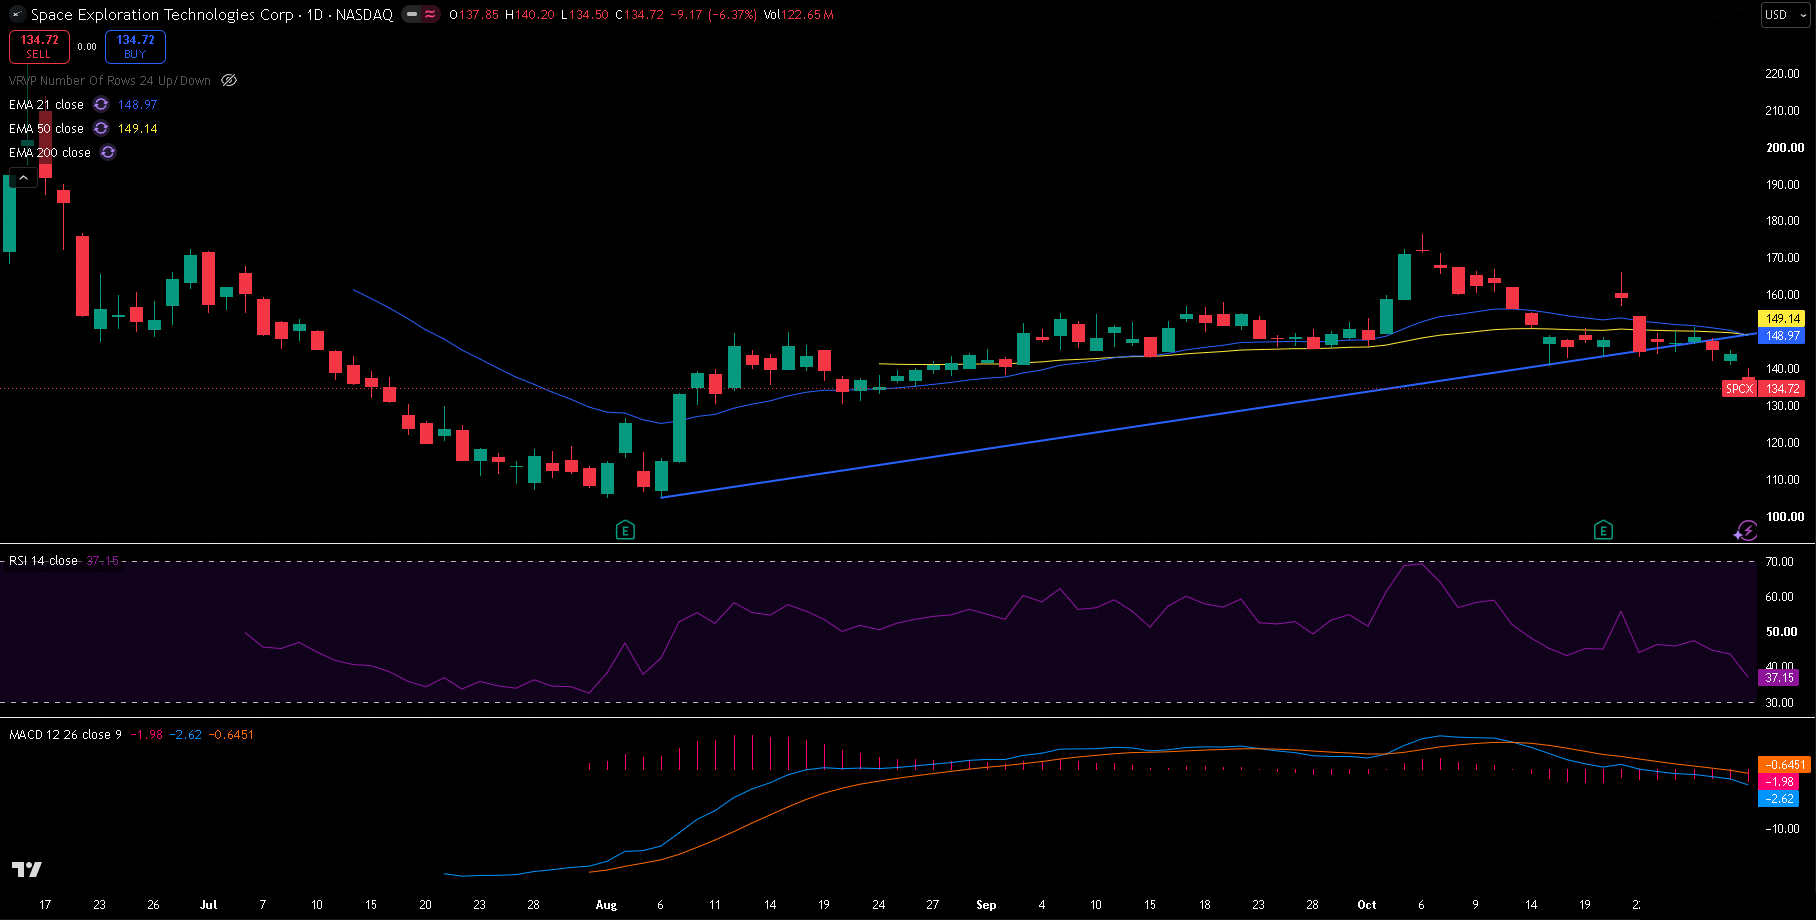
SPCX daily chart since the June listing, 30 October 2026 close — 21/50 EMA, RSI(14) and MACD(12,26,9), with the rising trendline from the 3 August low. There is not yet enough trading history for a 200-day EMA.
Trend and Structure
SpaceX listed on 12 June, spiked to 225.64 on 16 June and then fell to an all-time low of 104.83 on 3 August. The recovery from there built a rising trendline and peaked at 176.42 on 6 October. Since then the highs have been falling: the 21 October spike to 166.18 reversed the next day to 144.75, and last week stalled at 151.36. Price slipped below the trendline in late October, and Friday's drop to 134.72 also broke the 2 September low at 138.17. The 21 EMA (148.97) has just crossed under the 50 EMA (149.14), and price is well below both.
Key Levels
The level that matters most overhead is the 149 area, where the 21 and 50 EMAs, the broken trendline and the 38.2% retracement (149.07) all meet. Below, the 61.8% level at 132.18 is the next support.
| Type | Level | Why it matters |
|---|---|---|
| Resistance | 176.42 | 6 October high, top of the August–October rally |
| Resistance | 166.18 | 21 October spike high, reversed the next day |
| Resistance | 151.36 | 27 October high, last week's ceiling |
| EMA 50 | 149.14 | Medium-term trend |
| Fib 38.2% | 149.07 | With both EMAs and the broken trendline |
| EMA 21 | 148.97 | Short-term trend, just crossed under the 50 |
| Trendline | ~149 | Rising trendline from the 3 August low, now broken |
| Fib 50% | 140.63 | Lines up with the 15 October low at 140.66; lost on Friday |
| Support | 138.17 | 2 September low, broken on Friday |
| Current | 134.72 | Last close |
| Support | 134.50 | Friday's low |
| Fib 61.8% | 132.18 | Next retracement support |
| Fib 78.6% | 120.15 | Deeper retracement if 132 gives way |
| Support | 104.83 | 3 August all-time low |
Fibonacci levels are drawn from the 3 August low at 104.83 to the 6 October high at 176.42. The trendline level is approximate and read from the chart.
Momentum and Volume
RSI(14) is at 37.15, weak and falling but not yet oversold. MACD is at -2.62 against a signal line of -0.65, a histogram of -1.98: below zero and widening, so downside momentum is building. Friday traded 122.7 million shares against a 20-day average of about 104 million, so the break below the September low came on above-average volume.
Bull Case
The 61.8% retracement at 132.18 holds and price closes back above the 149 cluster of EMAs, trendline and 38.2% level. That would put the stock back inside its uptrend and open the 21 October high at 166.18, then the 176.42 peak.
Bear Case
A daily close below 132.18 would give back most of the August–October rally and open the 78.6% level at 120.15. Below that, the 3 August all-time low at 104.83 is the last support on the chart.
Trade Scenarios
| Direction | Trigger | Stop | Target |
|---|---|---|---|
| Long | Daily close above 149.14 | 139.00 | 166.18, then 176.42 |
| Short | Daily close below 132.18 | 142.00 | 120.15, then 104.83 |
Risk warning: Technical analysis reflects probability, not certainty. Levels are reference points, not signals. Capital at risk. This is educational content, not investment advice.