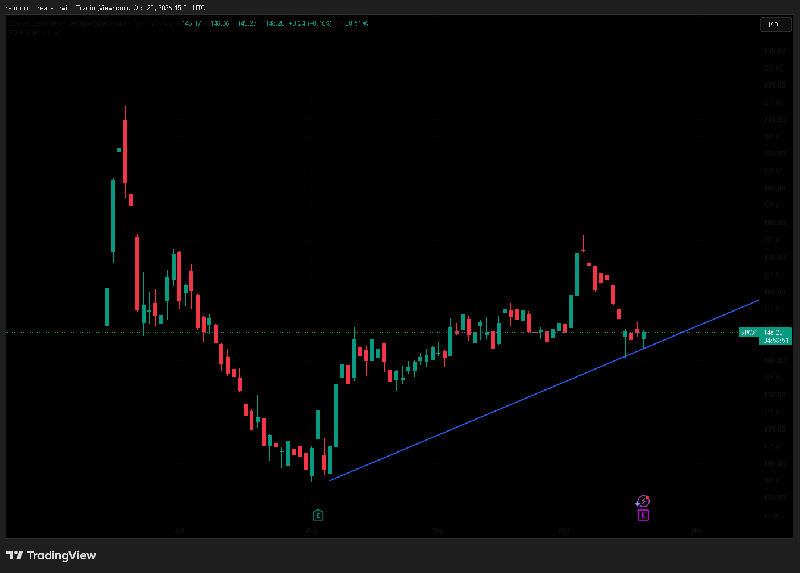
SpaceX (SPCX, Nasdaq) daily chart.
After the big spike to around $225 when it listed, it sold off hard to about $105 in early August. Since then it's been making higher lows, and I've drawn a trendline from that August low.
It pushed up to around $176 at the start of October, then pulled back to the trendline. There it printed a hammer and has bounced off the line.
Stops go below the low of the hammer, which also sits just below the trendline. So if that goes, both the pattern and the trend are broken.
Earnings look due soon going by the chart, so expect some movement.
What's everyone's view on this one?
Not financial advice – just my own chart view.