Meta has fallen 21% from its September high of 779.82 and closed Friday at 614.99, below all three EMAs. A double top at 771–780 gave way on 22 October with a 7% drop, and the slide has continued. The 609 low from Wednesday is the line to watch; below it, the 589–600 zone is next.
Daily Chart
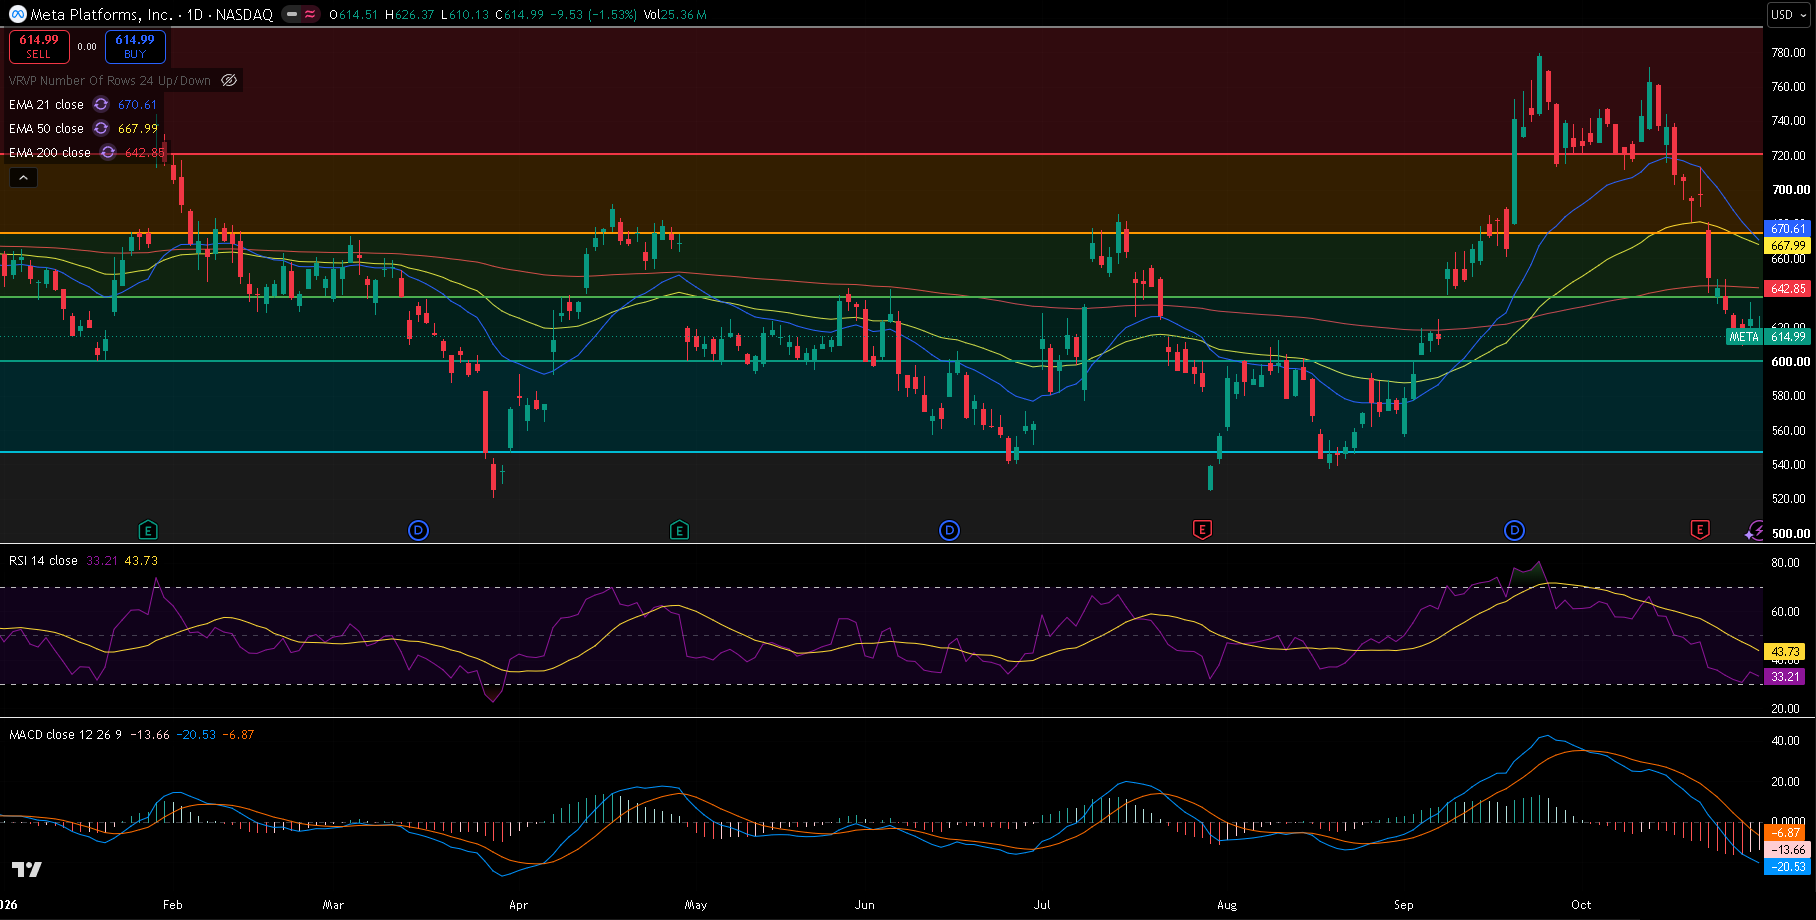
META daily chart, 30 October 2026 close — 21/50/200 EMA, RSI(14) and MACD(12,26,9), with horizontal levels near 720, 673, 636, 600 and 545. Price has dropped through the 636 level and is heading for the 600 line.
Trend and Structure
Meta rallied from 537.27 on 19 August to 779.82 on 24 September, then failed to get back above that peak, stalling at 771.27 on 13 October. The 22 October session broke the pattern: price fell from 697.52 to 648.85 on 40.6 million shares, and the selling carried on through last week to a low of 609.00 on Wednesday. Price is now below the 200 EMA (642.85) and well below the 21 (670.61) and 50 (667.99), which are about to cross lower. The whole September rally has been more than 60% retraced.
Key Levels
The level that matters most is the 600–609 band: Wednesday's low and the 600 line on the chart. Overhead, the 630–643 area — the 61.8% retracement, the 636 line and the 200 EMA — is the first resistance.
| Type | Level | Why it matters |
|---|---|---|
| Resistance | 779.82 | 24 September high, the 2026 high |
| Resistance | ~720 | Horizontal level on the chart |
| Resistance | ~673 | Horizontal level on the chart, with the 21 and 50 EMAs |
| EMA 21 | 670.61 | Short-term trend, turning down |
| EMA 50 | 667.99 | Medium-term trend |
| EMA 200 | 642.85 | Long-term trend, lost on 22 October |
| Resistance | ~636 | Horizontal level on the chart |
| Fib 61.8% | 629.92 | Retracement of the August–September rally, now broken |
| Current | 614.99 | Last close |
| Support | 609.00 | 28 October low |
| Support | ~600 | Horizontal level on the chart |
| Fib 78.6% | 589.18 | Deepest retracement before the rally is fully undone |
| Support | 556.10 | 1 September low |
| Support | 537.27 | 19 August low, start of the rally |
Fibonacci levels are drawn from the 19 August low at 537.27 to the 24 September high at 779.82. Horizontal levels marked ~ are read from the chart.
Momentum and Volume
RSI(14) is at 33.21, close to oversold. MACD is at -20.53 against a signal line of -6.87, a histogram of -13.66, falling steeply below zero — momentum is firmly with the sellers. Volume ran well above the 20-day average of about 23 million on the key down days: 40.6 million on 22 October and 51.3 million on 27 October.
Bull Case
The 600–609 band holds with RSI near oversold, and price closes back above the 200 EMA at 642.85. That would put the EMAs and the 673 level back in reach, with the 720 line above.
Bear Case
A daily close below 609.00 breaks Wednesday's low and opens the 600 line and the 78.6% level at 589.18. Below there, the 1 September low at 556.10 and the 19 August low at 537.27 would leave almost nothing of the September rally.
Trade Scenarios
| Direction | Trigger | Stop | Target |
|---|---|---|---|
| Long | Daily close above 642.85 | 618.00 | 670.61, then ~720 |
| Short | Daily close below 609.00 | 632.00 | 589.18, then 556.10 |
Risk warning: Technical analysis reflects probability, not certainty. Levels are reference points, not signals. Capital at risk. This is educational content, not investment advice.