McDonald's has broken out of its seven-month downtrend. The stock rose 2.7% on Thursday through the falling trendline from the March high and closed Friday at 258.12, up 12.6% from its 5 October low of 229.20. It is now testing the 61.8% retracement at 259.59; the 200 EMA near 274 is the bigger hurdle.
Daily Chart
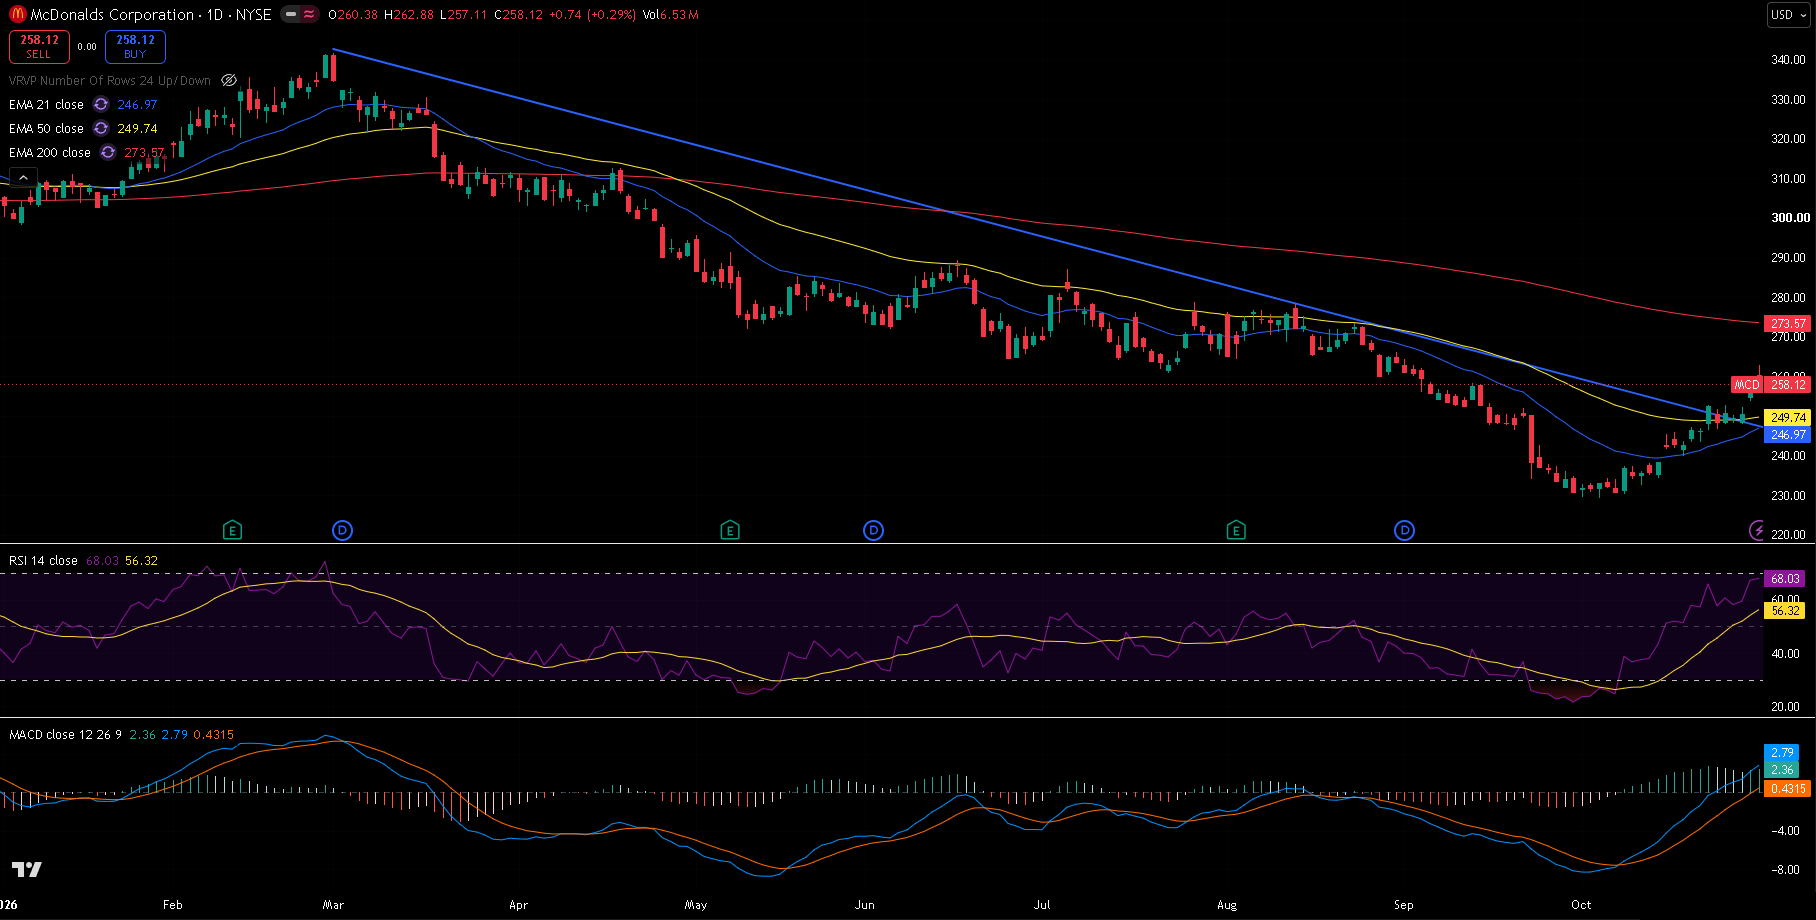
MCD daily chart, 30 October 2026 close — 21/50/200 EMA, RSI(14) with its moving average, MACD(12,26,9), and the falling trendline from the March high. Price broke above the trendline this week.
Trend and Structure
McDonald's fell from 341.75 on 2 March to 229.20 on 5 October, making lower highs under a falling trendline the whole way. October has been a steady recovery: price climbed back above the 21 EMA (246.97) and 50 EMA (249.74), and on Thursday cleared the trendline, which now sits around 250. Friday reached 262.88 before closing at 258.12. The 200 EMA (273.57) is still well above and falling, so the long-term trend has not turned yet.
Key Levels
The level that matters most is 259.6–262.9, the 61.8% retracement and Friday's high. Below, the broken trendline and the 21 and 50 EMAs around 247–250 should now act as support.
| Type | Level | Why it matters |
|---|---|---|
| Resistance | 278.37 | 13 August high |
| EMA 200 | 273.57 | Long-term trend, still falling |
| Fib 78.6% | 267.85 | Deepest retracement of the August–October fall |
| Resistance | 264.50 | 1 September high |
| Resistance | 262.88 | Friday's high |
| Fib 61.8% | 259.59 | Being tested now |
| Current | 258.12 | Last close |
| Trendline | ~250 | Falling trendline from the March high, broken on Thursday |
| EMA 50 | 249.74 | Medium-term trend |
| Fib 38.2% | 247.98 | With the 21 EMA at 246.97 |
| Support | 241.88 | 16 October low |
| Support | 229.20 | 5 October low, the 2026 low |
Fibonacci levels are drawn from the 13 August high at 278.37 to the 5 October low at 229.20. The trendline level is approximate and read from the chart.
Momentum and Volume
RSI(14) is at 68.03, close to overbought after a steady climb, and well above its own average of 56.32. MACD is at 2.79 against a signal line of 0.43, a histogram of +2.36, back above zero for the first time since August. Friday's 6.5 million shares was a little above the 20-day average of about 5.5 million.
Bull Case
Price closes above Friday's 262.88 high, clearing the 61.8% level. That opens the 78.6% level at 267.85 and the 200 EMA at 273.57, with the August high at 278.37 above.
Bear Case
With RSI near overbought, a pause is likely. A daily close back below the 21 EMA at 246.97 would put price back under the trendline and suggest the breakout has failed, opening the 16 October low at 241.88 and then 229.20.
Trade Scenarios
| Direction | Trigger | Stop | Target |
|---|---|---|---|
| Long | Daily close above 262.88 | 248.00 | 273.57, then 278.37 |
| Short | Daily close below 246.97 | 260.00 | 241.88, then 229.20 |
Risk warning: Technical analysis reflects probability, not certainty. Levels are reference points, not signals. Capital at risk. This is educational content, not investment advice.