Ford is trying to turn up from the bottom of its 2026 range. The stock fell from 17.78 in May to 11.44 on 23 October, close to the March low of 11.11, then jumped 3.4% on Thursday on heavy volume and held most of it on Friday at 12.25. Price is back above the 21 EMA; the 50 EMA at 12.70 is the next test.
Daily Chart
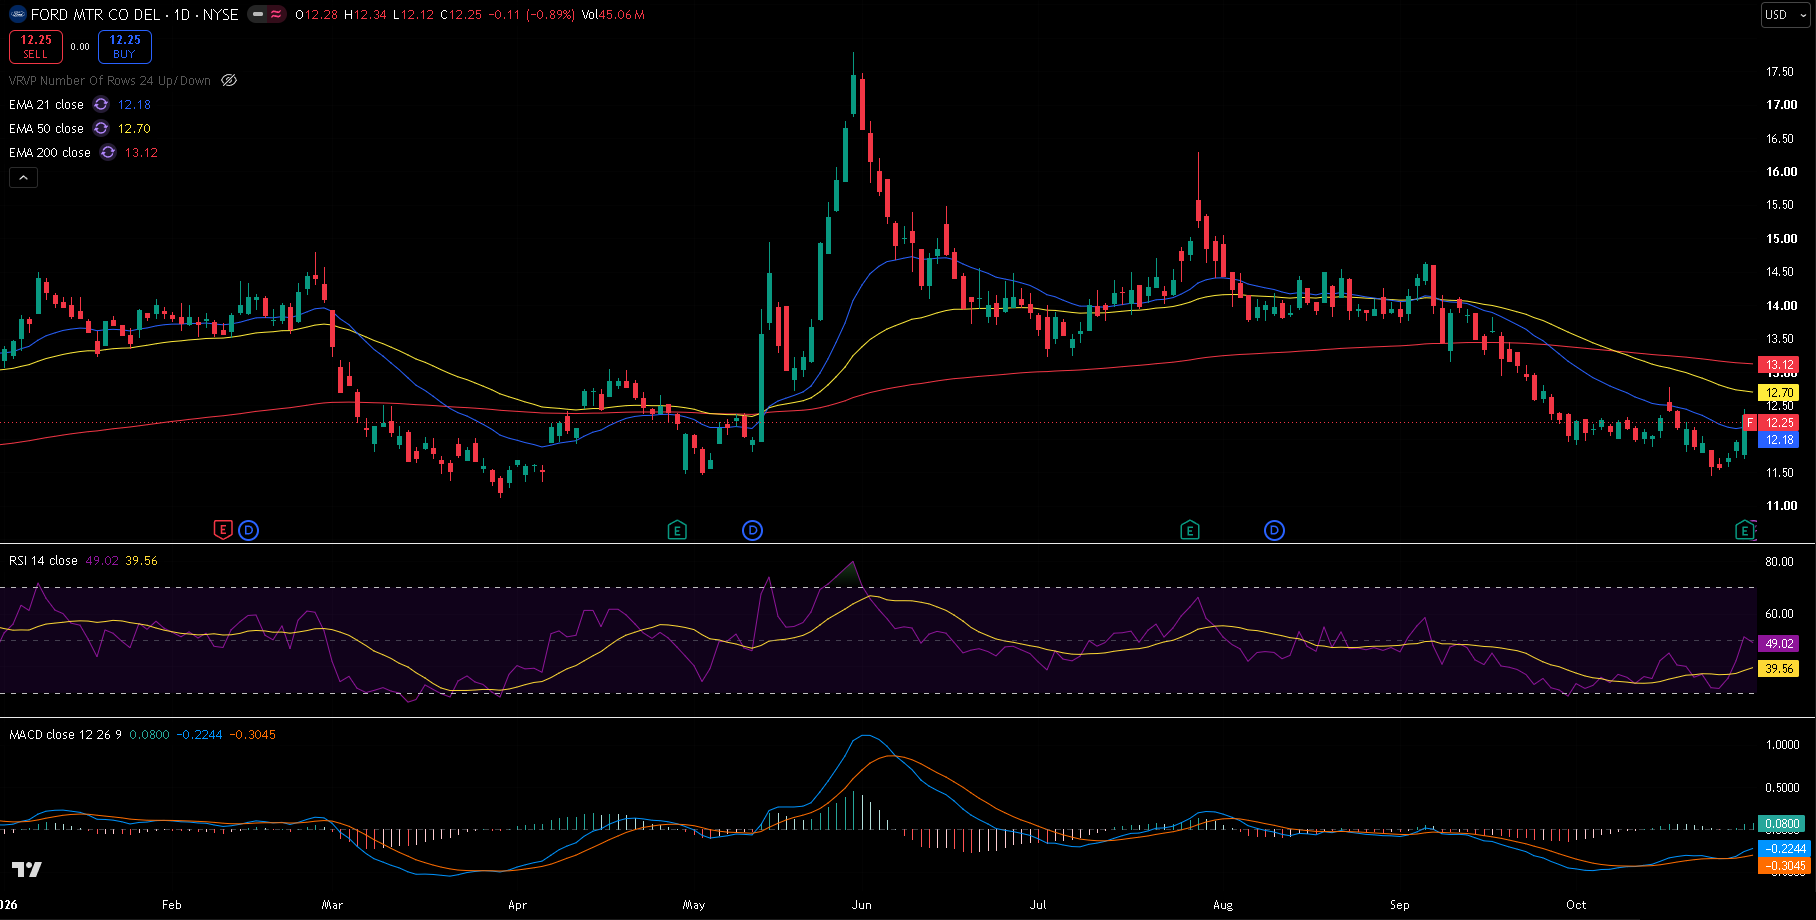
F daily chart, 30 October 2026 close — 21/50/200 EMA, RSI(14) with its moving average, and MACD(12,26,9). Price is bouncing off the 11.1–11.5 floor that has held since March.
Trend and Structure
Ford spiked to 17.78 on 29 May and has made lower highs since — 16.29 in July, 14.64 in September and 12.78 on 16 October. The lows have been firmer: 11.11 on 30 March, 11.35 in April, 11.46 in May and 11.44 on 23 October, so the stock is sitting on a floor it has defended all year. Thursday's push to 12.45 lifted price above the 21 EMA (12.18), but the 50 EMA (12.70) and 200 EMA (13.12) are still overhead and falling.
Key Levels
The level that matters most is the 11.1–11.5 floor. Overhead, the 12.66–12.78 band — the 38.2% retracement, the 50 EMA and the 16 October high — is the first resistance.
| Type | Level | Why it matters |
|---|---|---|
| Resistance | 14.64 | 4 September high |
| Fib 61.8% | 13.42 | Retracement of the September–October fall |
| EMA 200 | 13.12 | Long-term trend; with the 50% level at 13.04 |
| Resistance | 12.78 | 16 October high |
| EMA 50 | 12.70 | Medium-term trend |
| Fib 38.2% | 12.66 | First meaningful retracement |
| Resistance | 12.45 | Thursday's high |
| Current | 12.25 | Last close |
| EMA 21 | 12.18 | Short-term trend, reclaimed on Thursday |
| Support | 11.44 | 23 October low |
| Support | 11.11 | 30 March low, the 2026 low |
| Fib 127.2% | 10.57 | Extension of the fall if the floor breaks |
Fibonacci levels are drawn from the 4 September high at 14.64 to the 23 October low at 11.44.
Momentum and Volume
RSI(14) has risen to 49.02, well above its own average of 39.56. MACD is at -0.22 against a signal line of -0.30, a histogram of +0.08: a bullish crossover, still below zero. Thursday's 70.6 million shares was about 1.7 times the 20-day average of 41 million, so the bounce came with real buying.
Bull Case
The bounce carries through the 50 EMA and price closes above the 16 October high at 12.78. That would end the run of lower highs and open the 61.8% level at 13.42, with the September high at 14.64 above.
Bear Case
The bounce stalls under 12.70 and price closes below the 23 October low at 11.44. That puts the 2026 low at 11.11 in play, and a break there opens the 127.2% extension at 10.57.
Trade Scenarios
| Direction | Trigger | Stop | Target |
|---|---|---|---|
| Long | Daily close above 12.78 | 11.90 | 13.42, then 14.64 |
| Short | Daily close below 11.44 | 12.40 | 11.11, then 10.57 |
Risk warning: Technical analysis reflects probability, not certainty. Levels are reference points, not signals. Capital at risk. This is educational content, not investment advice.