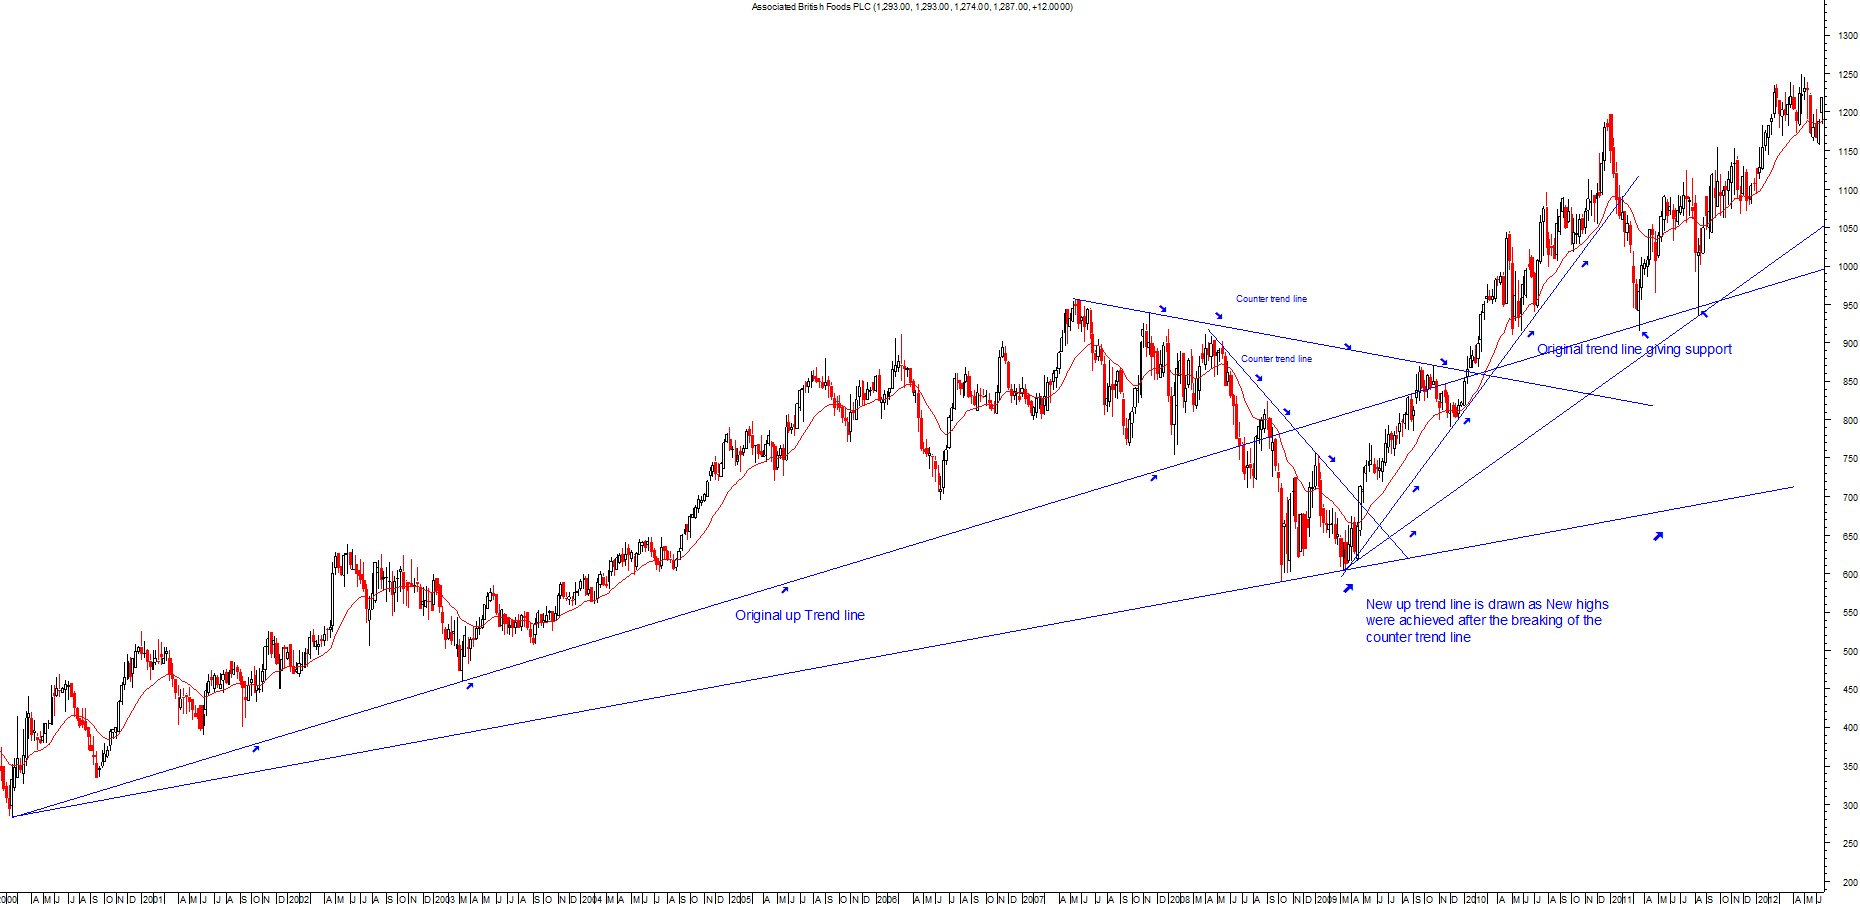
Major uptrends can last years and within the uptrend you can have intermediate counter trends.
Even though the major trend is up you may have downtrends that last a few months within the bigger trends. These are what identify the bigger trends in the future.
Please click on chart below for larger image
In an uptrend the idea is to buy the dips, you use the trend lines as a buying area.
The longer the trend line is in play the more significance it has, the trend line that has been in play for 1 year has more significance than one that's only been in play for a couple of months.
Trend line breaks
For a trend line break to be valid it has to close the trading day below the trend line however, sometimes this is not enough and the price breaks back up.
You do get false breaks and a way around this is to look for a 3% penetration, this would normally help to filter out false breaks but will mean a late exit.
Once a trend line breaks it normally becomes resistance so it's always good to project the line into the future(see chart above for example).
The best trend lines are the ones that have a 45 degree angle. Trend lines may have to be redrawn if they are to steep as steep trend lines are hard to maintain and the same goes for flattish trend lines.

