MACD(Moving Average Convergence/Divergence)
This is one of the most popular indicators out there and was developed by Gerald Appel.
This is a momentum indicator where the MACD line is made up from 2 exponentially smoothed moving averages of closing prices.
The difference between 26 and 12 day exponential moving averages. The signal line is made up of a 9 day exponential moving average.
The signals are given once the MACD crosses over the 9 day exponential moving average(signal line).
Please click on chart below for larger image
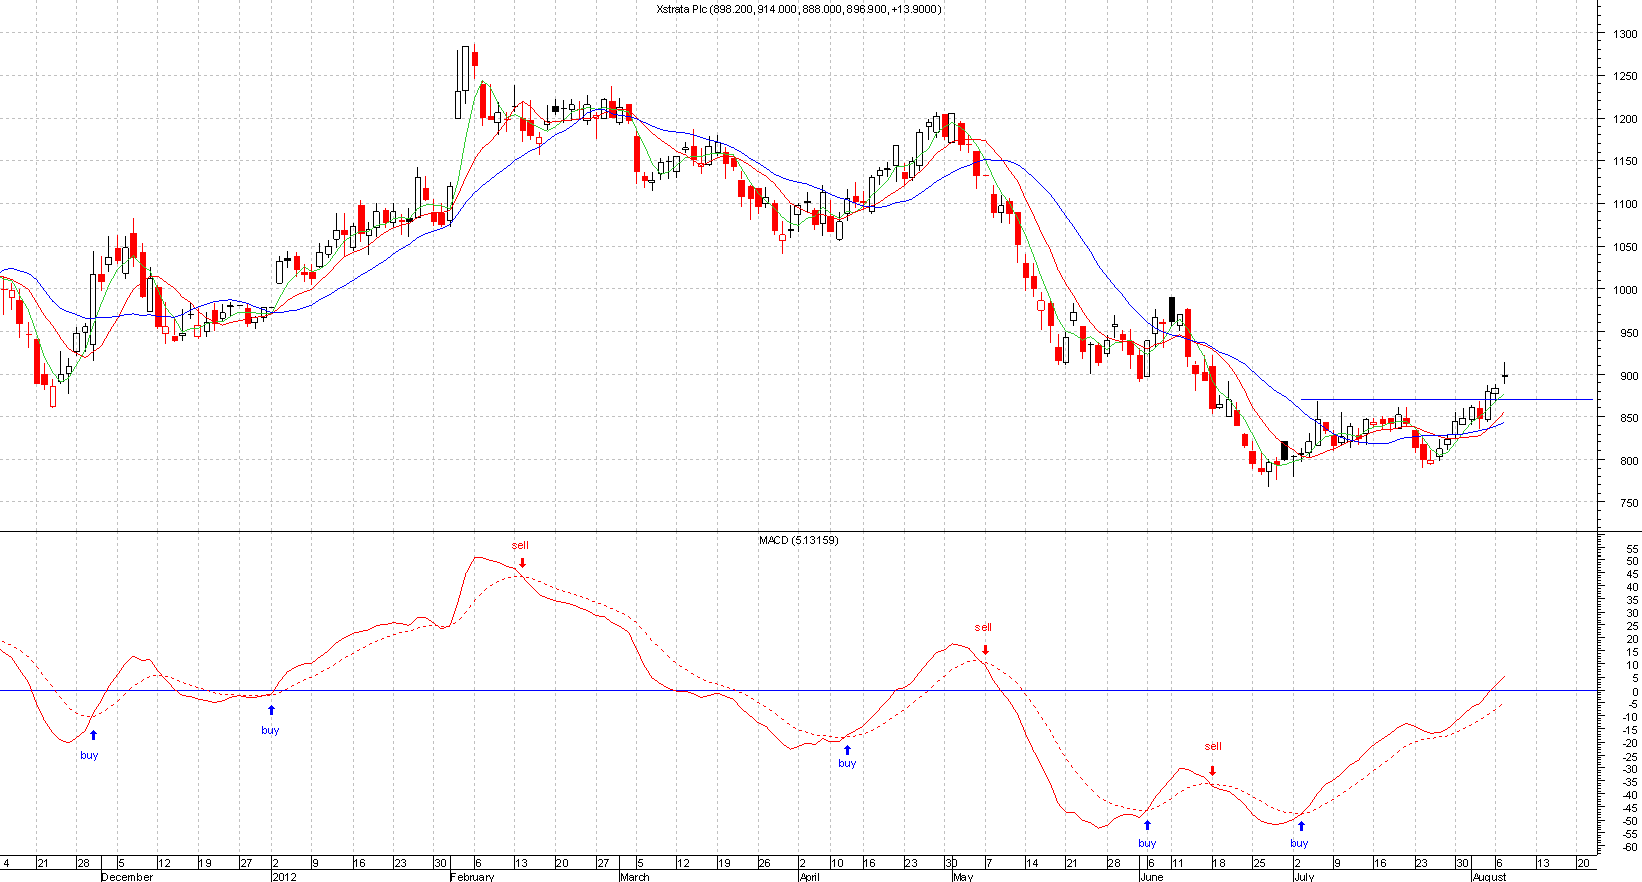
Another way to generate signals is the crossing of the Zero line from above and below.
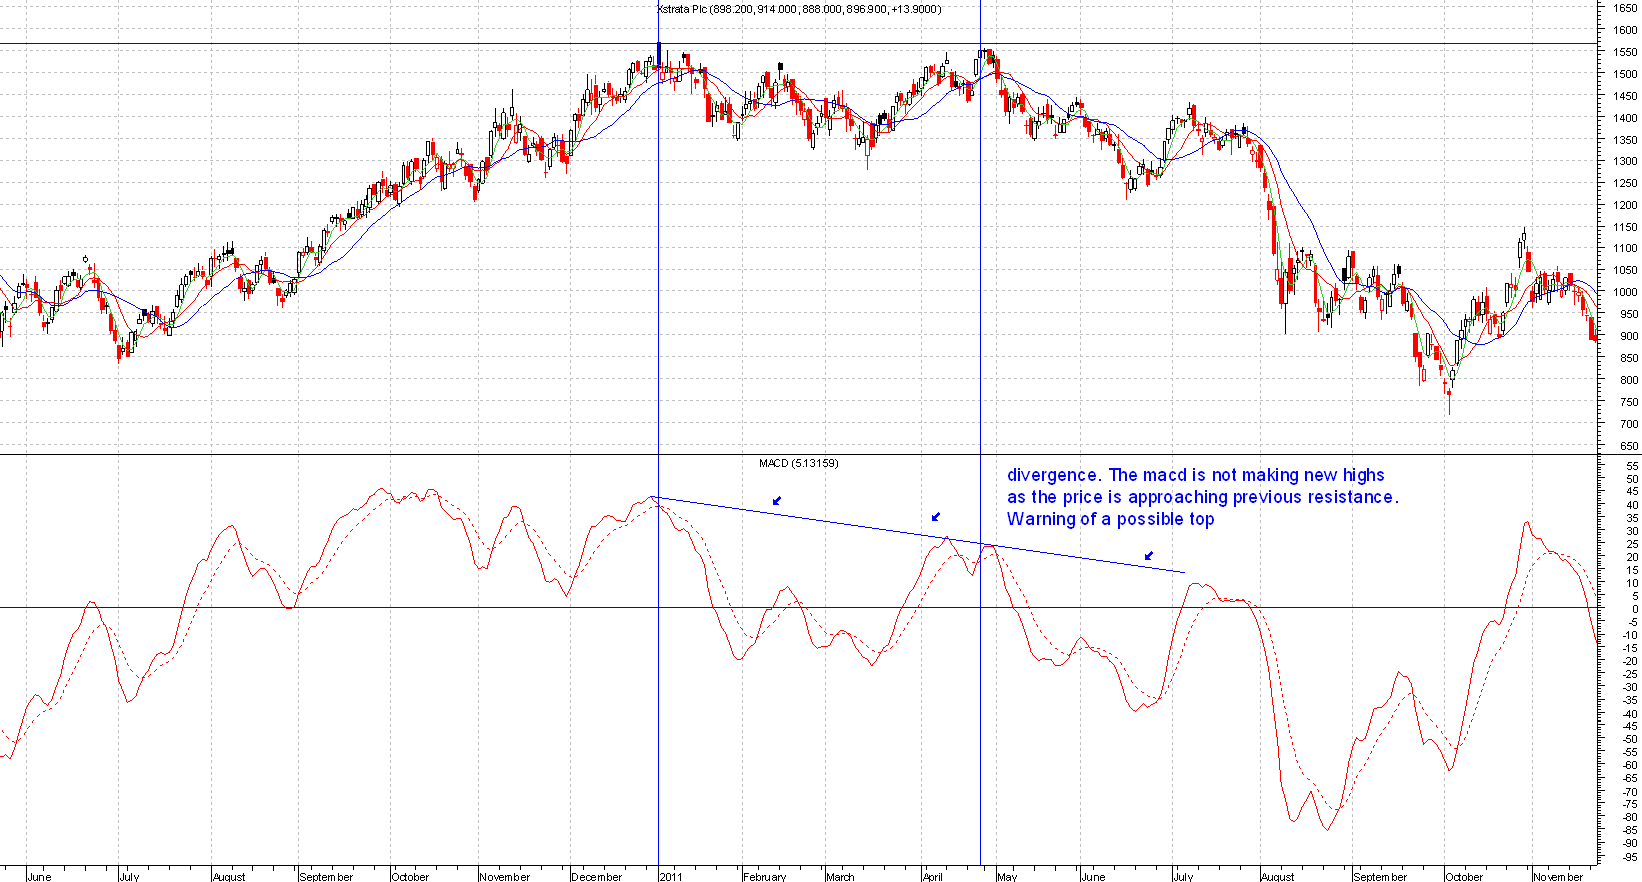
You can also look for divergence, if the price goes to new high yet the MACD is in the overbought position (well above zero) and turns down this could forewarn of a possible top.
The same would apply for a buy signal.
Please click on chart below for larger image
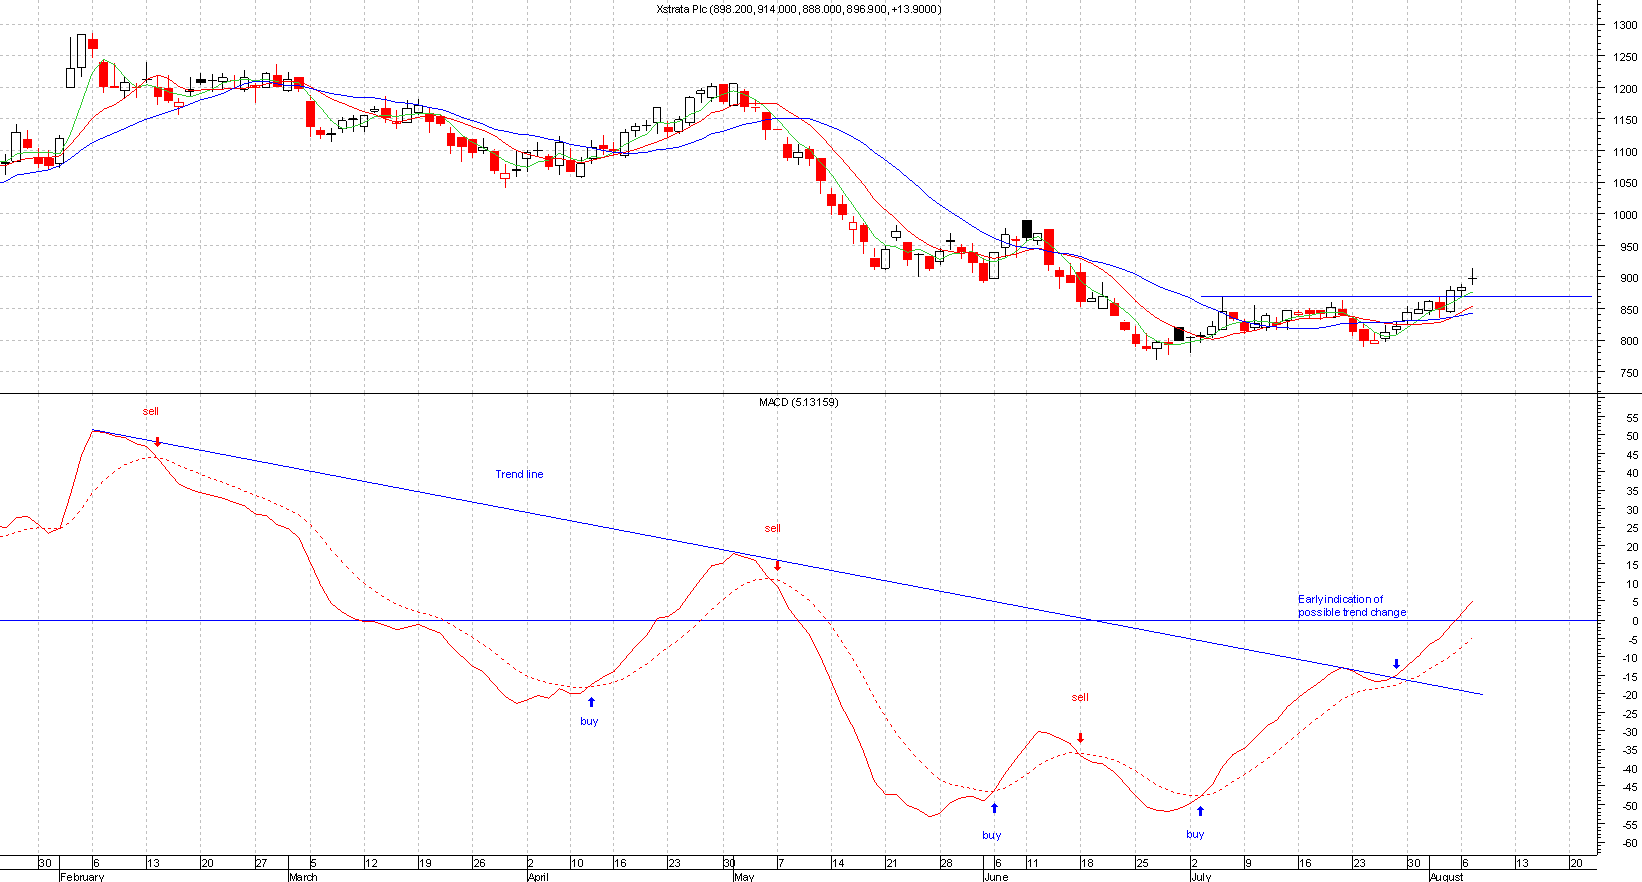
Like most indicators you can draw trend lines on the MACD to help you determine possible trend changes. This can get you early entry into trades.
See chart below for XTA(Xstrata):
Please click on chart below for larger image