123 High is a method that is used to find possible tops in charts. The way this works is, that it's looking for an end to the higher highs.
So basically waiting for the first lower lows to form, this is best used at the top of an up trend. Once you suspect a peak in the share price then you would label the peak as 1.
Then wait for the retrace to come then label that retrace 2 (It's best to have a lower candle or bar). Then once the price moves higher again then look to label this 3 as long as the price does not go higher than 1.
You will only label this 3 once the price starts to move lower again. The formation should be really clear to see like the example below:
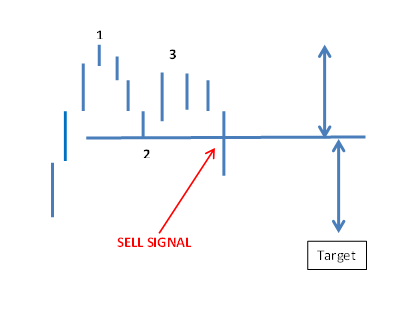
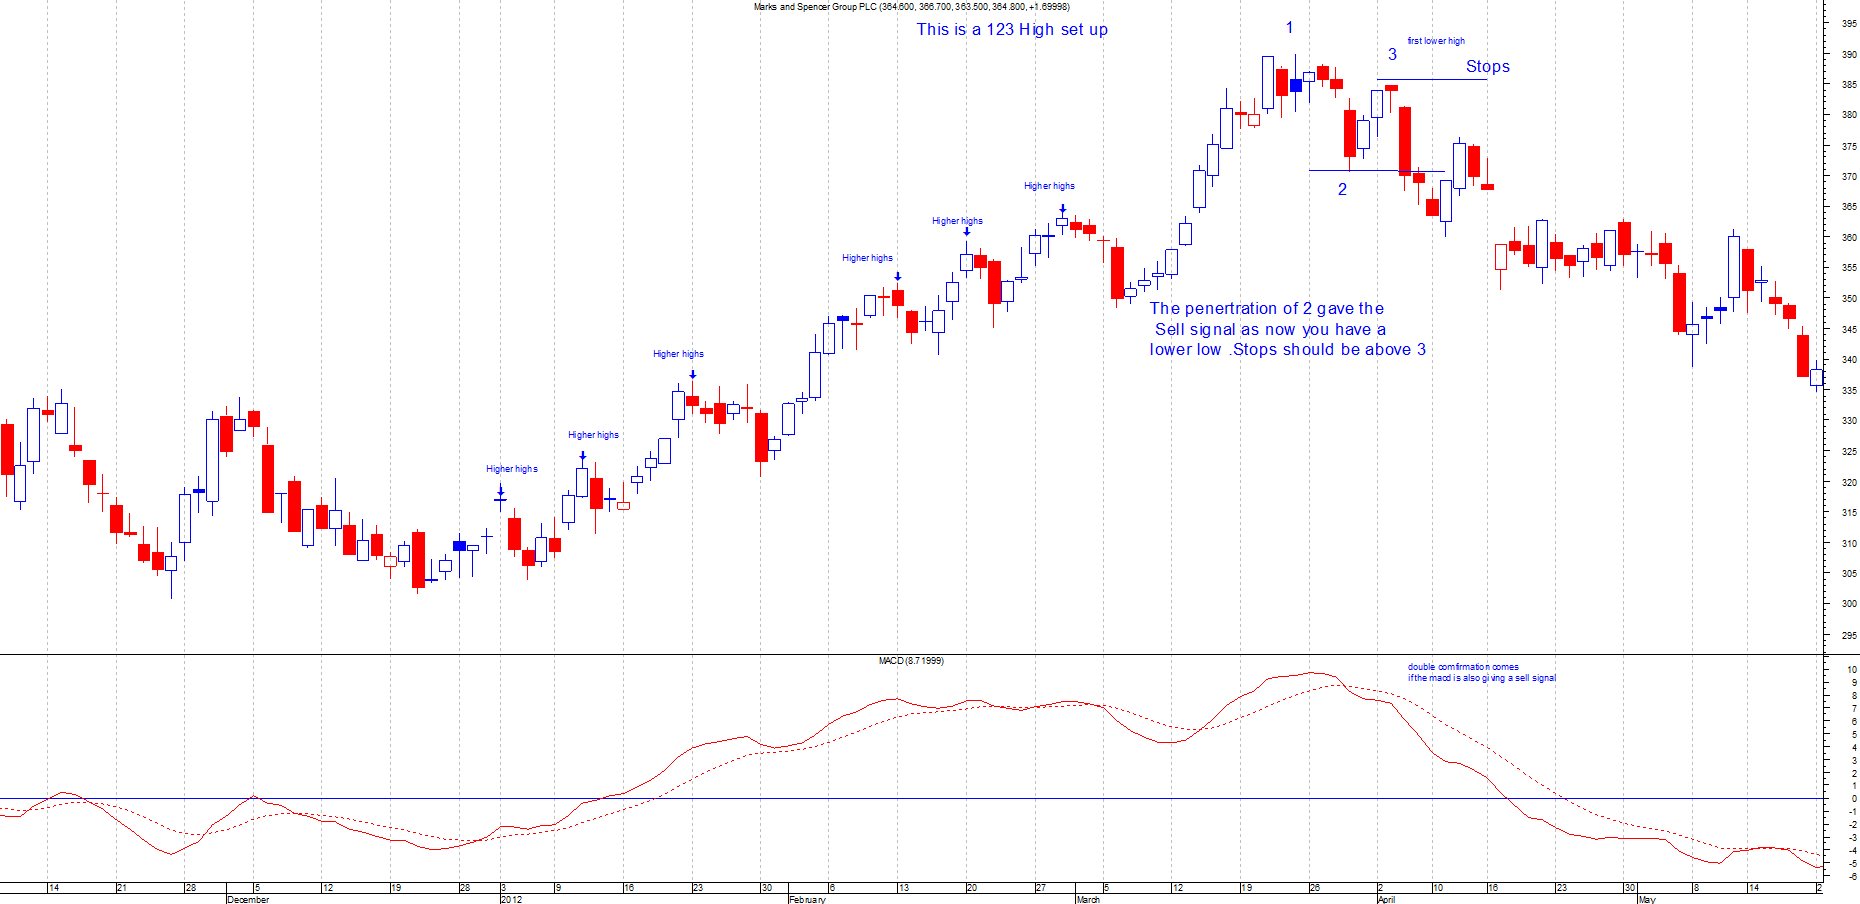
The sell signal comes once you breach the low of 2, now you should have lower highs formed. Stops should be placed above the high of 3.
The first target should be the distance from the high of 1 to the low of 2, this then is projected from the break out point from the bottom of 2.
You do get a lot of false signals and the best way around this is to use a Macd indicator. If this is also showing a sell signal then this adds to the signal.
This should help to reduce the number of false signals.
Please click on chart below for larger image
Also bear in mind that there will be more false signals with a 123 high than a 123 low. This is due to the fact that most correction seems to be in a 3 wave move as such. So you need to be Extra carefull when trading of a 123 high formation.