A triple top forms when the price rises to the same area three times and fails each time. A triple bottom is the reverse: three drops to the same floor that all hold. Both are reversal patterns, and both are rarer than double tops and double bottoms. When they do complete, they can mark an important turn.
What a triple top looks like
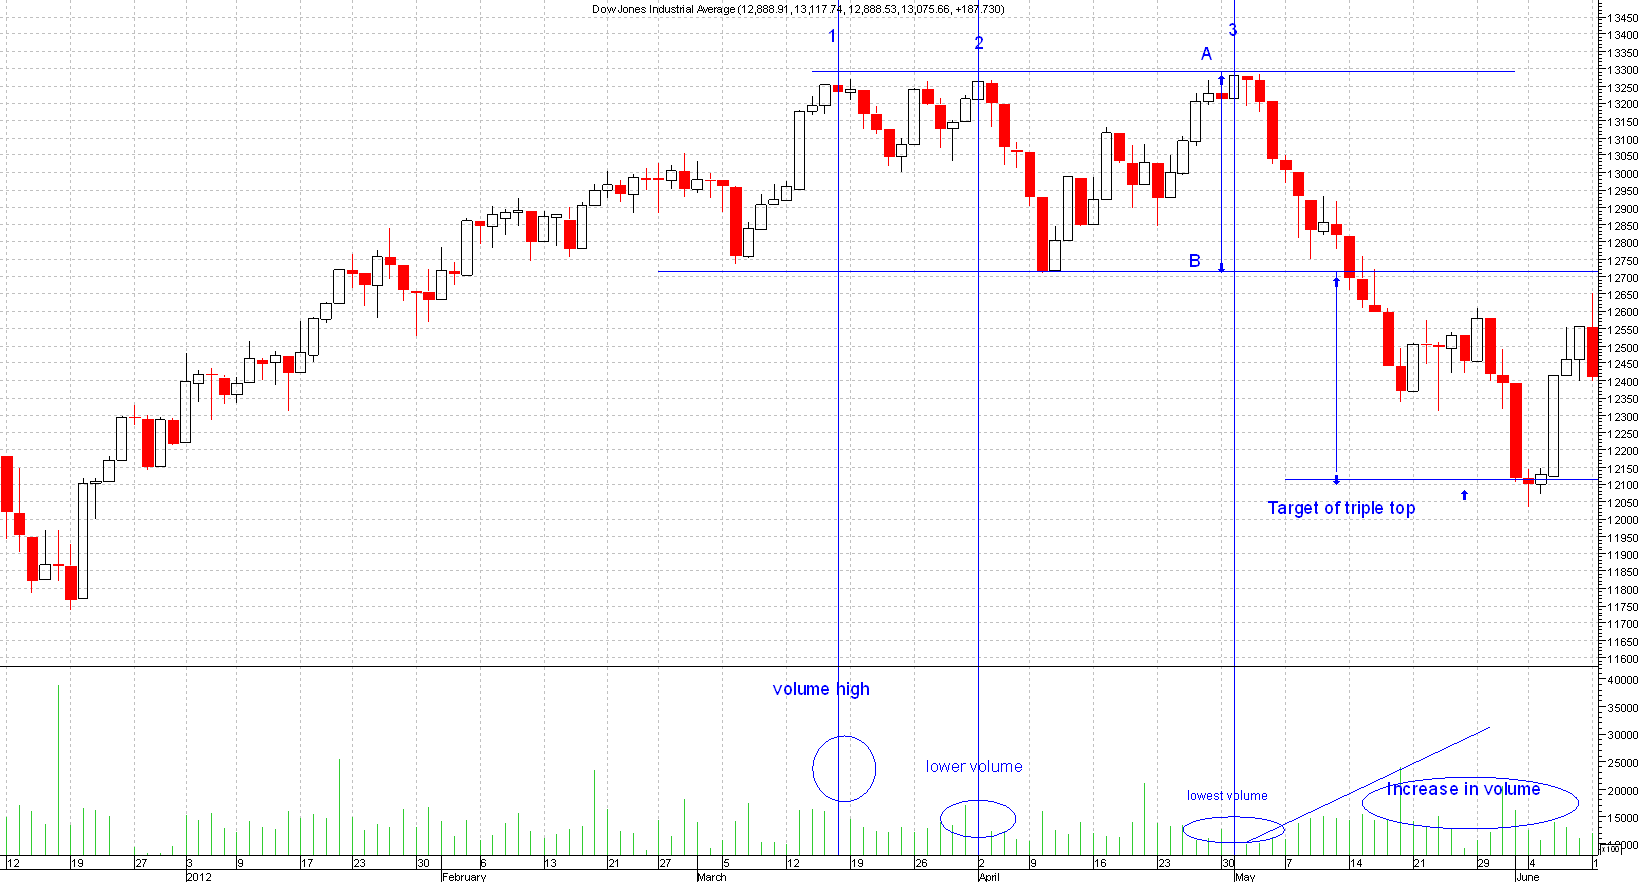
After an uptrend, the price makes three peaks at roughly the same level. The peaks do not have to match exactly; close enough is fine. Between the peaks are two lows. Draw a line under those two lows: that is support.
The signal comes only when the price closes below that support. Until then, the market is simply ranging, and it could still break out higher.
Volume often gets lighter on each peak, then rises when support breaks.
What a triple bottom looks like
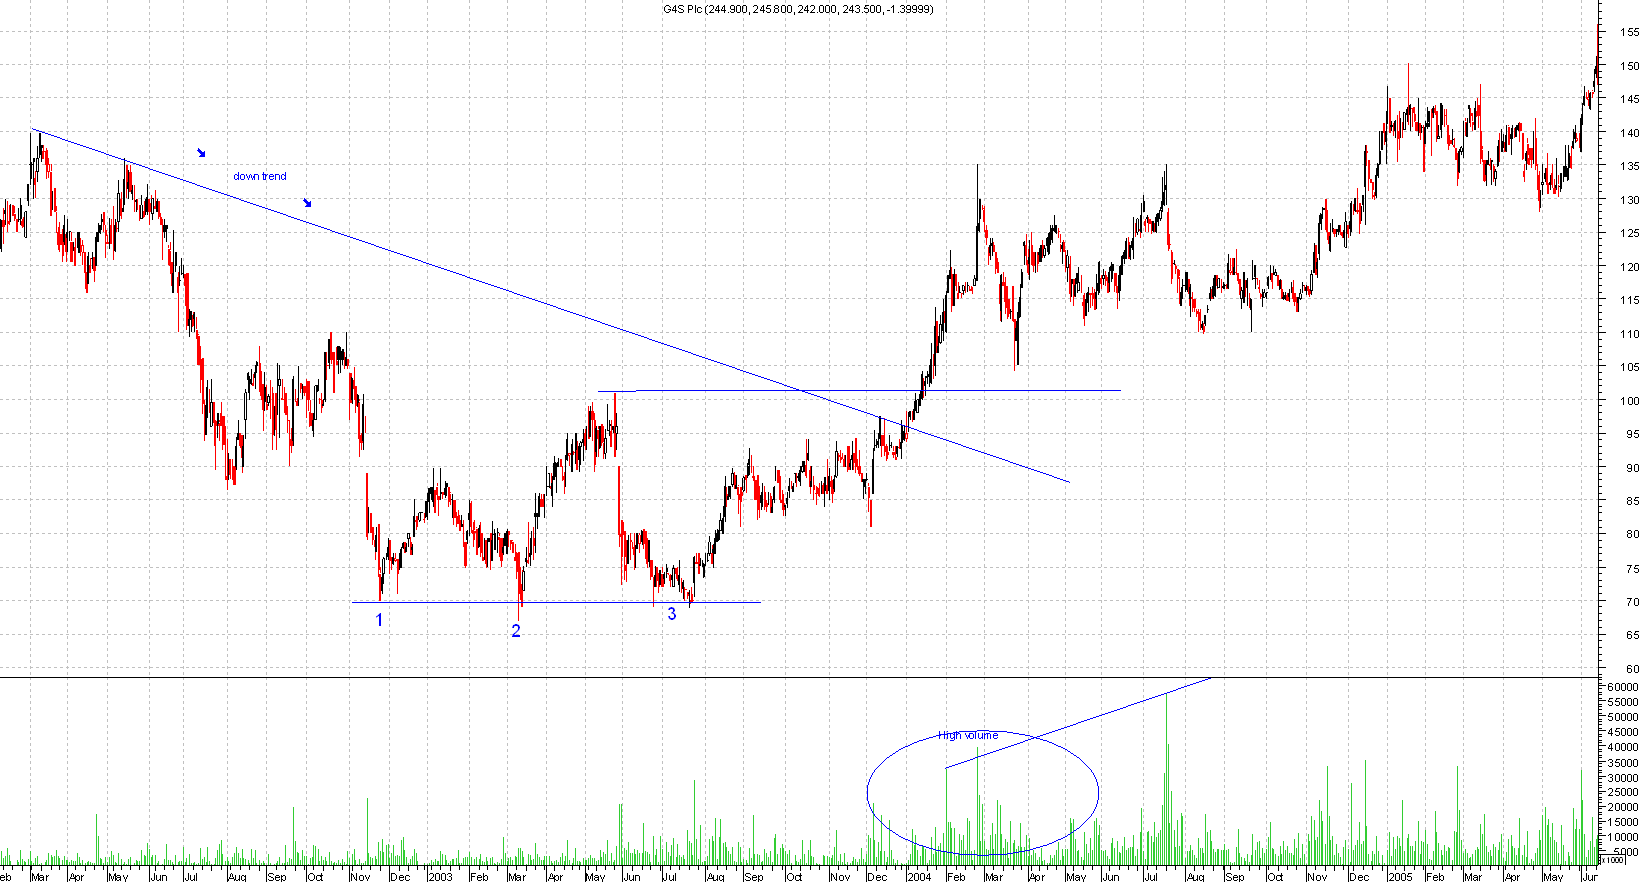
After a downtrend, the price falls to roughly the same low three times and bounces each time. Draw a line across the two highs between the lows. The buy signal comes on a close above that line, ideally on a rise in volume.
How to trade them
- Entry: for a triple top, sell or take profits on a close below the support line. For a triple bottom, buy on a close above the resistance line.
- Stop: above the highest peak for a triple top; below the lowest low for a triple bottom. A tighter option is just the other side of the broken line.
- Target: measure the height of the pattern (from the peaks to the support line, or from the lows to the resistance line) and project it from the breakout.
Mistakes to avoid
- Selling at the third peak because you expect it to fail. Many "third peaks" turn into breakouts.
- Ignoring the trend before the pattern. A triple top needs an uptrend before it; a triple bottom needs a downtrend.
- Confusing it with a range. Inside a long sideways market, three touches of the same level are normal and not a reversal signal on their own.
Related guides
This guide is for education only and is not financial advice. Trading carries risk; you can lose more than you expect.