Skip to content
S&P 5007,676.77up +0.70%Nasdaq26,169.38up +0.82%Dow52,361.58up +0.28%DAX25,395.78down −0.06%GBP/USD1.3323down −0.14%EUR/GBP0.8369down −0.07%Brent111.48up +0.67%Gold4,006.0down −0.80%Bitcoin79,704down −0.38%Prices at 09:07
ChartsView

SAINSBURY PLC (LON: SBRY)

More
11 years 4 months ago #12520 by tayalsmith1
SELL

TARGET 251.70

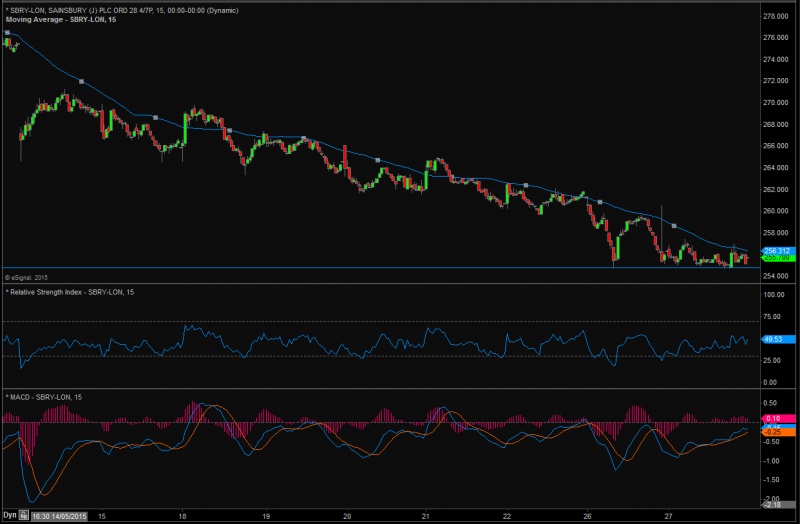
The Major trend of SAINSBURY PLC it is showing strength for selling. If it breaks the level of 254.70 then it can show downside movement for the target of 251.70 with the stop loss of 257.70.

CHART FORMATION:-
Stock is trading in a range and line will lead to downside movement. Stock is trading below the 50 DMA with negative bias.


Please Log in or Create an account to join the conversation.

Moderators: remo
Powered by Kunena Forum
Use the arrow keys to move and Enter to openSearch every page

Share tips