- Posts: 634
- Thank you received: 1438
STANDARD CHARTERED PLC, STAN
- WaveSurfer
-

- Offline
- Senior Poster
-

Less
More
11 years 5 months ago - 11 years 5 months ago #12477
by WaveSurfer
Replied by WaveSurfer on topic STANDARD CHARTERED PLC, STAN
What time frame tl ?
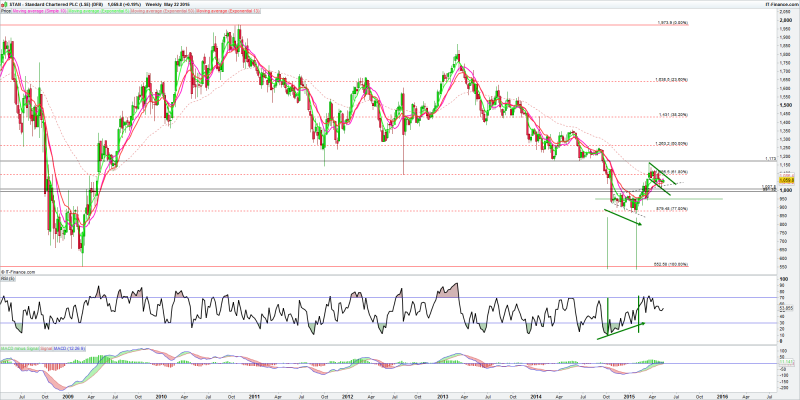
on longer time frame i see something different...and could be worth quite a few points on the upside imo if the formation plays out.
dl.dropboxusercontent.com/u/40497882/Sta...%28DFB%29_Weekly.png
rgds
WS
on longer time frame i see something different...and could be worth quite a few points on the upside imo if the formation plays out.
dl.dropboxusercontent.com/u/40497882/Sta...%28DFB%29_Weekly.png
rgds
WS
Last edit: 11 years 5 months ago by WaveSurfer.
Please Log in or Create an account to join the conversation.
- tayalsmith1
-
 Topic Author
- Offline
- Fresh Boarder
-

Less
More
- Posts: 80
- Thank you received: 16
11 years 5 months ago #12462
by tayalsmith1
STANDARD CHARTERED PLC, STAN was created by tayalsmith1
INDICATORS
RSI is at 49.60 level with -ve side, in next session downward movement is expected.
MACD and Signal line is below the zero level line.
SELL RECOMDATION
RSI is at 49.60 level with -ve side, in next session downward movement is expected.
MACD and Signal line is below the zero level line.
SELL RECOMDATION
Please Log in or Create an account to join the conversation.
Moderators: remo