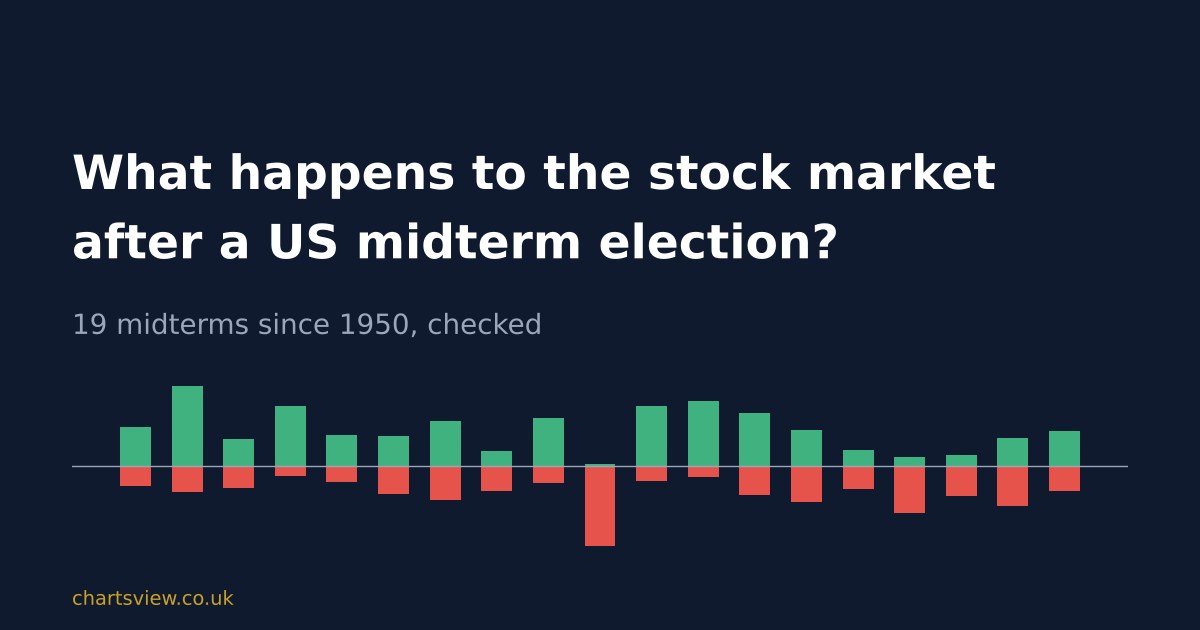
The US midterm elections were held on 3 November 2026. So what usually happens to the stock market next? We checked the S&P 500 for the 12 months after every midterm since 1950, all 19 of them, using daily closing prices. The pattern is clear, but it is not a smooth ride.
The short answer
In all 19 midterm years, the S&P 500 was higher a year after election day. The average rise was 15.1% and the middle result was 14.5%.
That is about twice the usual. Taking the same November-to-November stretch in every other year since 1950, the average rise was 7.3%.
But most years had a big dip first
In 11 of the 19, the index fell 10% or more from a high at some point in those 12 months. The average biggest fall along the way was 11.6%. Every one of those 11 still finished the year higher.
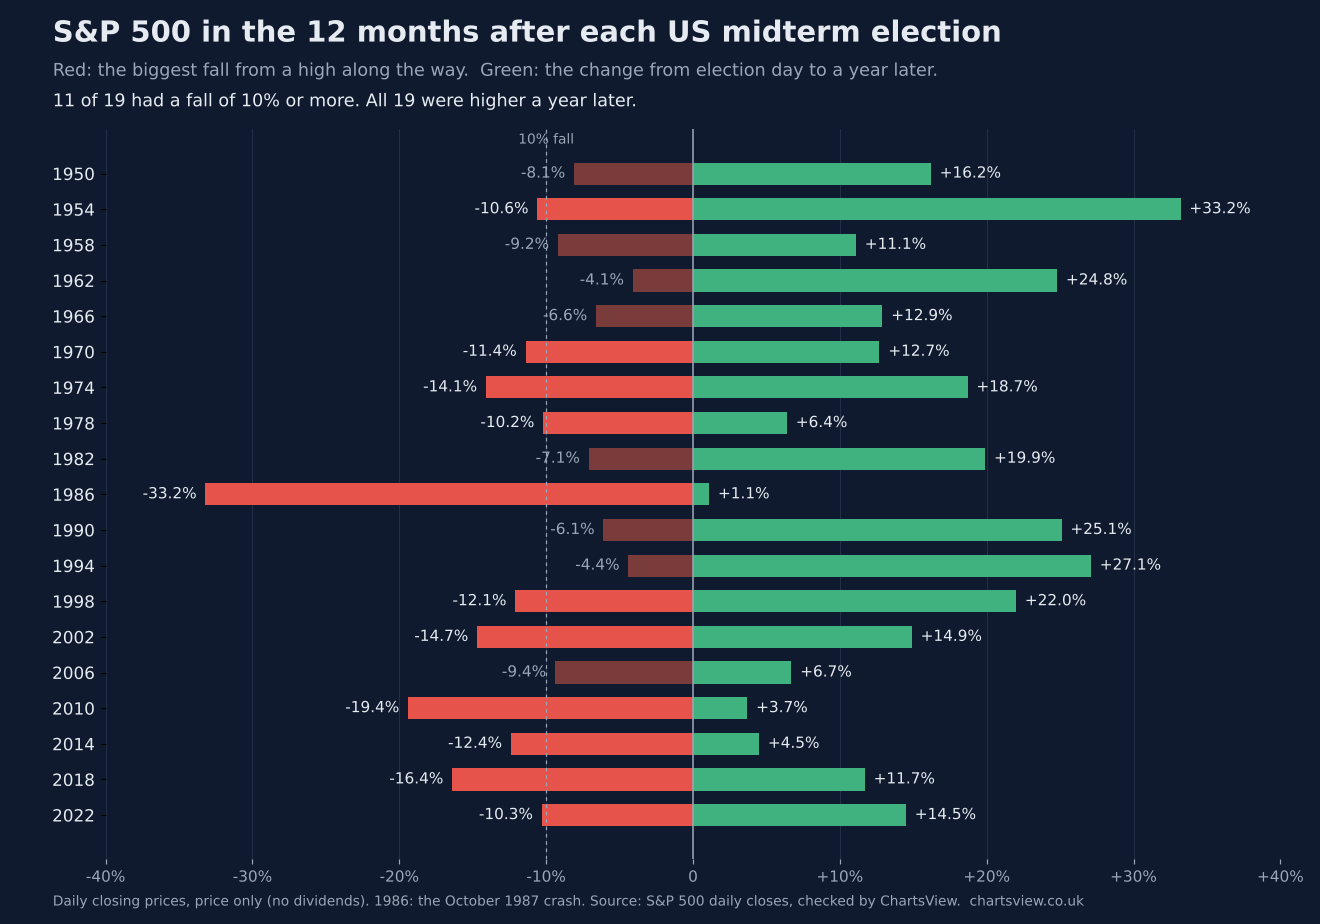
The worst was after the 1986 midterm. The October 1987 crash took the index down 33.2% from its high, yet a year after election day it was still 1.1% higher. The other big falls came in 2010 (19.4%, the 2011 US debt-rating downgrade), 2018 (16.4%, the sell-off into Christmas 2018) and 2002 (14.7%, the end of the dot-com bear market).
Every midterm since 1950
| Midterm | Biggest fall within 12 months | When the low came | 12 months later |
|---|---|---|---|
| 1950 | -8.1% | Jun 1951 | +16.2% |
| 1954 | -10.6% | Oct 1955 | +33.2% |
| 1958 | -9.2% | Sep 1959 | +11.1% |
| 1962 | -4.1% | Jul 1963 | +24.8% |
| 1966 | -6.6% | Nov 1967 | +12.9% |
| 1970 | -11.4% | Nov 1971 | +12.7% |
| 1974 | -14.1% | Sep 1975 | +18.7% |
| 1978 | -10.2% | Nov 1979 | +6.4% |
| 1982 | -7.1% | Nov 1982 | +19.9% |
| 1986 | -33.2% | Oct 1987 | +1.1% |
| 1990 | -6.1% | Jan 1991 | +25.1% |
| 1994 | -4.4% | Dec 1994 | +27.1% |
| 1998 | -12.1% | Oct 1999 | +22.0% |
| 2002 | -14.7% | Mar 2003 | +14.9% |
| 2006 | -9.4% | Aug 2007 | +6.7% |
| 2010 | -19.4% | Oct 2011 | +3.7% |
| 2014 | -12.4% | Aug 2015 | +4.5% |
| 2018 | -16.4% | Dec 2018 | +11.7% |
| 2022 | -10.3% | Oct 2023 | +14.5% |
Why might it happen?
Nobody can prove the reason, but three explanations come up again and again:
- The uncertainty is over. Before the vote, investors do not know who will control Congress. Once the result is known, that worry goes.
- Split government means fewer surprises. The president's party usually loses seats at the midterm, which makes big new laws harder to pass. Markets tend to like that.
- The third year of a presidency. The 12 months after a midterm fall in a president's third year, which has often been strong for shares as attention turns to the next election.
What it means if you trade
Nineteen elections is a small sample, and the past is no promise. A record of “up every time” can end in any year, and other things matter more: interest rates, company profits, wars, oil prices.
The useful lesson is about the path, not the end point. In most of these years there was a fall of 10% or more before the gains came. If you are buying for the year ahead, size your positions so a 10% to 20% dip does not force you out. Our free guides on position sizing and stop losses show how. If you trade the Dow, our US30 analysis is updated after each session.
For reference, the S&P 500 closed at 7,568.92 on election day, 3 November 2026.
How we checked the numbers
We used the S&P 500's daily closing prices, price only (no dividends). Each window runs from the last close on or before election day to the last close on or before the same date a year later. Where the market was shut on election day, as it often was before the 1980s, we used the day before. The biggest fall is the largest drop from any closing high to a later closing low inside that window. Prices come from Yahoo Finance, and we checked them against the Federal Reserve's FRED data from 2016 onwards.
This is general information, not financial advice. Share prices can fall as well as rise.