Well we have all read "the rules" and there are thousands of these types of things out there, but these are personal to me through my journey the past few years and thought I would put "pen to paper" for a change...Now I'm not perfect, still make wads of mistakes, I'm high risk, go against the heard and the trend, but learning when to hold them and when to fold them is what I've tried hard to learn the past few years....I've taken big losses and recently started making bigger gains, whilst still having the occasional -30% shocker.....this is more about "common sense" than absoloute techncial trading but it's good now and then to remind yourslef of who you are and have you really put into practise what you have learned?......I know I've got progressively better and hope you all have as well....anyway a few bits n bobs of what I've learn't (there's...
Continue reading
Here we're going to look at a live example of this theory in action. Prices almost never perform precisely to TA theory so please view this post as educational rather than a trading tip.
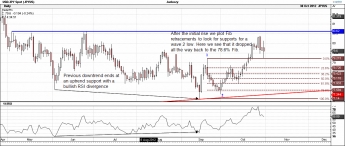
USDJPY had been in a downtrend which ended at a known uptrend support with a bullish RSI divergence. We've seen an initial rise and retrace so we can see how the theory matched up:
dl.dropbox.com/u/20815047/USDJPYexample1.gif
We can see it dropped to the 78.6% Fib so we plot the Fib extensions from there to give us resistances on the way up to a wave 3 target:
dl.dropbox.com/u/20815047/USDJPYexample2.gif
We have not (so far) reached that target so the rest is theoretical. The wave 3 target from the Fib extensions comes in very close to a known, strong resistance level so it seems a good place to trade from. We can then theorise as to how the rest of...
Continue reading
Here we have a sequence of charts showing a theoretical 5 "perfect" Elliott Waves up.
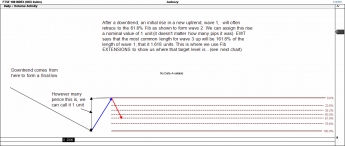
We start by assuming the share has been in a downward trend, forms a final low and then begins a new trend up with wave 1:
dl.dropbox.com/u/20815047/EWTwaves1%2C2.gif
This wave 1 up ought to also consist of a sequence of 5 smaller degree waves up but we'll leave that for now. The main point here is that the initial wave 1 up will often be followed by quite a severe retracement, usually to the 61.8% Fib level. This is thought to be due to the collective psyche still being unsure about the new trend causing many to take profits early having been trapped in the previous downtrend.
Following this retracement, price begin to look quite cheap again near to the previous downtrend low and traders buy this level since it represents good value compared to all of...
Continue reading
VIDEO THIS WEEK AT BOTTOM GIVES BULL AND BEAR CASE
(I'm bullish long term but wanting bear case for short term entry..cheeky!)
As always click on chart several times to "maximise screen"
Tab down etc for the VIDEO....(if you want to learn anything)
The trade idea
Whilst XEL has it's many fans and supporters my view this week is to "await cheeky entry"
both the bull case (still entact) and the bear case (quite possible)
This could be 140 or 64p so as always view both risk/reward and don't leverage
To limit risk I'm looking at tranche buying again if we see my prefered entry
What's my entry and exit targets...well watch the video
apologies again for the dodgy scots twang
I'm seeing plenty of aim stock that look like their starting to approach the bottom
But for now I'm waiting a few more days,weeks or till Dec before commting...
Continue reading


