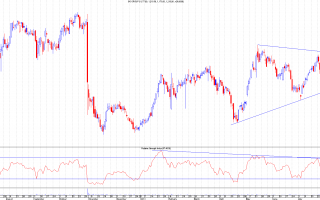
AMC made a new high today and looked for all money that it would close above the key 9.5p level.It didn't, however, but it still looks bullish with 2 closes in 3 days above 9p. It just needs that close over 9.5p to kick on. Still a hold for me. ...
Continue reading
AMC finally broke out and closed above the 9/9.5p resistance and looks to have backtested that level intraday.The target for this move is 13.5p based on the inverse H&S with a range of 4p from the 9.5p neckline.There are resistance at 12.25p and 14p too. ...
Continue reading
Essar Energy took a nice trendline bounce today suggesting that this trend is still in good shape. It's also a higher low so a 123-low trade could beckon on a break of the earlier bounce high at 146.7p.This would be the cue to go long targeting the 155p and 164.5p resistances. Stops should be below today's low. ...
Continue reading
This is an update to the Interesting Chart section on www.chartsview.co.uk, this section is updated every week and provides shares that have great potential for the coming weeks. In this blog I will be looking at how well these tips have done by showing you the before and after picture.
This blog is not updated every week as some times the shares may breakout the following week and therefore it's pointless to just show 1 or 2 breakouts every week. These past 2 weeks have been a bit slow as only seven shares have broken out, there has been better success with the currency and index trades mentioned in the forums and a few shares that were not part of the interesting chart section.
Currency or index trades are not included in the interesting chart section as they change daily and need closer attention. The interesting chart section is only focused...
Continue reading
This is an update to the Interesting Chart section on www.chartsview.co.uk, this section is updated every week and provides shares that have great potential for the coming weeks. In this blog I will be looking at how well these tips have done by showing you the before and after picture.
The interesting chart section needs to be looked at on a regular basis as some times the companies that have been put up only move or brake out a few weeks later. It can be hard to go through all the charts but for people that have MetaStock or any other professional charting package it would be easier to keep track, as you would just have to save them on to your charting package and view them daily.
Here goes....
18th March 2013
DOM.L
BEFORE This is the chart of Domino's when I mentioned this:
AFTER: This has moved 40 points...
Continue reading


