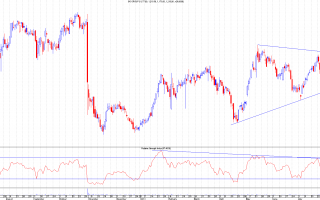
We can see how this has now broken through the huge weekly ascending triangle, hit the next resistance at 454p (important historic one) then dropped back to almost test the 432p breakout before motoring on.The breakout was indicated early be the RSI breakout on the 15th May and it backtested the RSI trendline perfectly. It's amazing how often RSI works better than price for supports and resistances.Next resistance for MKS is 492p where the big gap down occurred in Jan 2008. From there it may well drop back to test the 454p breakout but that long term goal of 672p remain valid for now. Original link...
Continue reading
LLoyds Banking Group is now firmly into a major resistance area of the 58.02p gap, 60.86p and 63.4p price highs. For Elliott Wave enthusiats, there also looks to be a complete set of 5 waves up, including the subwaves, from the 21p area and the RSI has formed a clear long term bearish divergence so a retrace may be due on this stock.Supports to look for are at the wave 3 high of 56.14p, the trendline at 48.41p (today, falling daily), the wave 4 low at 46.08p (also the 38.2% Fib), 39.25p and 36.73p (close to the 61.8% Fib). Original link...
Continue reading
GENL didn't quite make to to its all time high at 943p on the recent attempt and looks to be in corrective mode now.It's still clearly in an uptrend as shown by the RSI staying above the 30 mark (barring a blip) so should find support before resuming upwards.Supports are at 883p (currently at it now), 834p, and strong support at 771p from the recent lows and the trendline in a few weeks. Resistances are at 930p and 943p; above 943p is blue sky. Original link...
Continue reading
This weekly chart says it all really.Genel Energy managed to close the week before last bang on the previous high and breakout level of 883p. This was taken as a signal of strength by the market and it was subsequently bought pushing the SP to a new high.As long as the SP stays above 943p then it should continue up into blue sky. The indecision can clearly be seen by the doji that's formed so far this week. We'll see how it looks on Friday's close. Original link...
Continue reading
Amur Minerals is still finding 9p resistance tough to break but it has closed above the RSI downtrend resistance on Friday and looks to be in either an ascending triangle or inverse head and shoulders pattern.If it can close above 9p both of these patterns point towards a target of c. 13.5p. A return to the 6.75p support would be bearish though and indicate further downside as it would break the inverse H&S pattern. ...
Continue reading


