


Maybe not yet time to get Xcited?
in ChartsView Blog:- Font size: Larger Smaller
- Hits: 13328
- 8 Comments
- Subscribe to this entry
- Bookmark
VIDEO THIS WEEK AT BOTTOM GIVES BULL AND BEAR CASE
(I'm bullish long term but wanting bear case for short term entry..cheeky!)
As always click on chart several times to "maximise screen"
Tab down etc for the VIDEO....(if you want to learn anything)
The trade idea
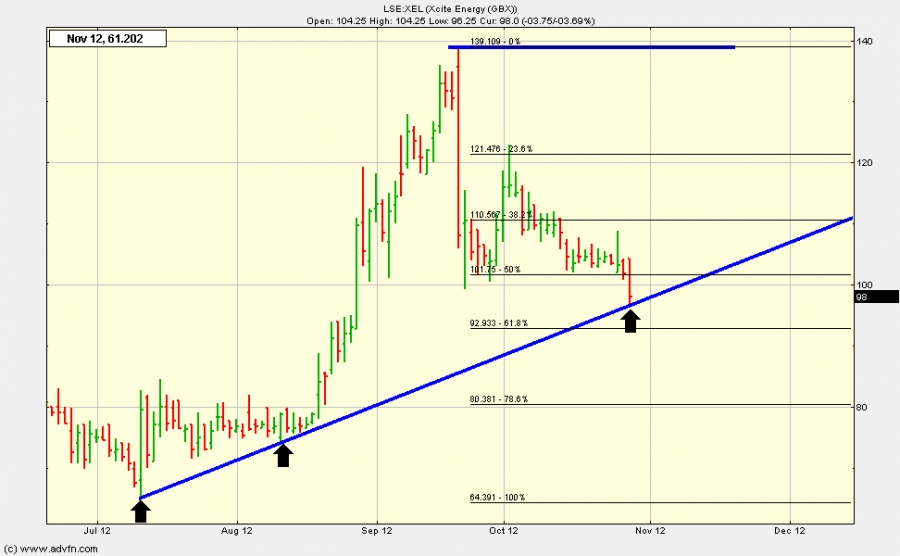
Whilst XEL has it's many fans and supporters my view this week is to "await cheeky entry"
both the bull case (still entact) and the bear case (quite possible)
This could be 140 or 64p so as always view both risk/reward and don't leverage
To limit risk I'm looking at tranche buying again if we see my prefered entry
What's my entry and exit targets...well watch the video
apologies again for the dodgy scots twang
I'm seeing plenty of aim stock that look like their starting to approach the bottom
But for now I'm waiting a few more days,weeks or till Dec before commting more funds as ftse may be "rounding top"
Remember Aim is high risk..if you can't lose 30% in a blink then don't play with aim
THE VID...CLICK ON LINK
http://screencast.com/t/4AGlXisDg
Comments
-
Monday, 22 October 2012
I seem to look at similar things to you when looking at charts TS, which is nice, and good to hear your Scottish ;-p although your voice reminds me of someone.
I usually have the chart set up with the indicators I use regularly already on it, and have previous trendlines saved - I don't know if you do that or go in with a new approach every time? I remember someone else I respect telling me to go in blank every time.
I also have a longer term view on BT - but not sure how you actually put it up on the screen as an actual picture? -
Monday, 22 October 2012
http://dl.dropbox.com/u/63552262/Charts/Shares/BT_-_weekly_-_22-10-12.png
Here's my chart TS.
I think that BT could also be ranging (you mentioned the potential range of 200-240 in your video) and its possible we see 201-204 again in the near future.
That said, the 50 week moving average is providing some support at the moment, but there is some severe bearish divergence indicating a double top @ 240ish.
I think its a sit out for me at the moment til it touched either 237 or 203ish -
Monday, 22 October 2012
BT could well go to 203 hence tight stop recommendation...my view is always risk/reward as opposed to pure technicals. To load a picture you need to save the file in pictures and then click on image..then find if from the browse funtion and click attatch...I can't post the picture unless it is saved in pictures others I just get the link which you have to post on....Remo listened to this at an early stage as seeing first hand generally gets more intrest...remember click on a link a few times and it gets even bigger..I've changed the chart to show you my long and short term view
-
Monday, 22 October 2012
Agreed TS. Risk/reward is crucial.
Do you ever incorporate Elliot Wave Theory in your thoughts?
I must admit I never do, and its mostly my ignorance to it that is the deciding factor rather than knowing it but not putting any weight towards it. -
-
Saturday, 03 November 2012
Still waiting for this to pan out...This has getting both bulls and bears attention at the minute and until we get above 105 I'm still expecting it to go lower...for now it's playing with the support area and uptrend line...I'll keep an eye on this next week or so
-
Saturday, 10 November 2012
Well for now xel is starting to breakdown and whilst 95-105 was the range that implies a 10p move is comming...hopefully that will take us close to my target entry where I will buy my first tranche (I'm a cheeky chancer so 3 planned 83/85 (2) 73/75 3(63/65)...for the record I'd like to see 140-180 but previous support would be resistance for the trade and only news will see the spike high....for now it's wait and see or hold for the bigger payday me thinks
This entry also ties in with horizontal support (214), and 61fib of the rise from July 25th to Sept 13th (216.15)