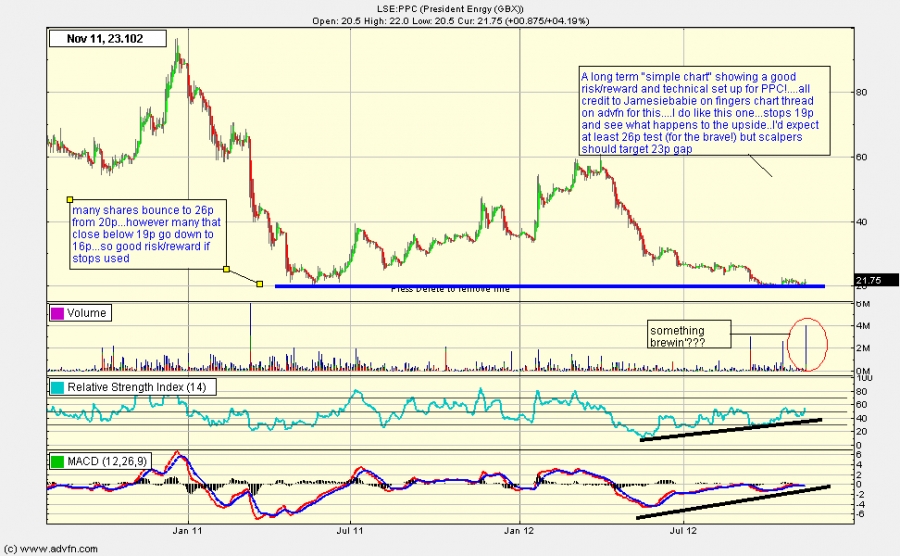
Well I've borrowed this from another chartists on advfn and simply tweeked the chart...as usual this is for the more "speculative" traders/investors/speculators and gamblers out there..however I've noticed many shares at 20p make a quick bounce to 26p (no guarantees!) and a close below 19p would signal lower, so bail if it doesn't work. Not up to speed with the fundies on this and for me it is a simple risk/reward punt......no video chart this week as it's clear how this has been viewed and constructed....I've given a wideshot view as opposed to the usual close up just to highlight previous support around 20p
...
Continue reading

ChartsView Blog:
- Subscribe to this category
- Subscribe via RSS
- 252 posts in this category

This is something that I have created for my style of trading.
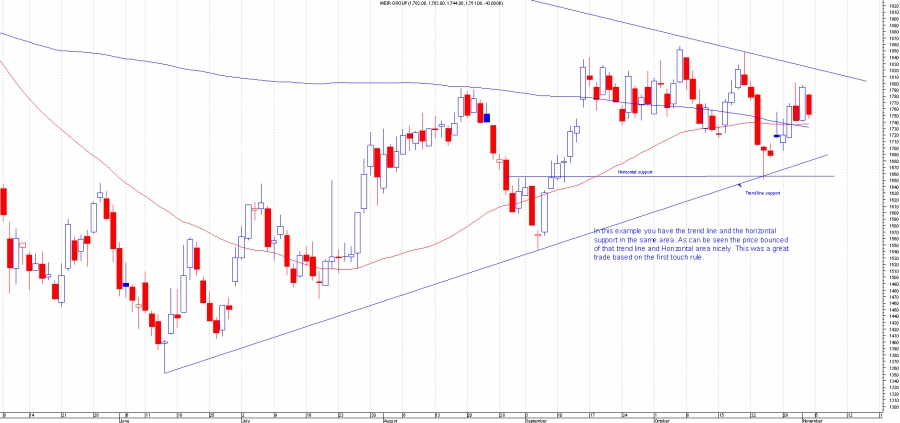
The idea being that if you know of a strong Resistance area or Support Then I would place my shorts or Longs at that exact level. This method can be going against the trend some times.
For shorting (betting down), I would take out shorts at known resistance levels. Not just any resistance level. The level should be an important level and not just a conventional resistance. It should be a trend line or gaps or the level should have 2 or more resistance levels converging. The more the better
See example below:
The idea being that you're respecting the resistance or support level. You're basically placing your trade where all the smart money is lined up. At a good resistance level there will be a lot of people closing or taking profits at that area. It's using technicals...
Continue reading
Well we have all read "the rules" and there are thousands of these types of things out there, but these are personal to me through my journey the past few years and thought I would put "pen to paper" for a change...Now I'm not perfect, still make wads of mistakes, I'm high risk, go against the heard and the trend, but learning when to hold them and when to fold them is what I've tried hard to learn the past few years....I've taken big losses and recently started making bigger gains, whilst still having the occasional -30% shocker.....this is more about "common sense" than absoloute techncial trading but it's good now and then to remind yourslef of who you are and have you really put into practise what you have learned?......I know I've got progressively better and hope you all have as well....anyway a few bits n bobs of what I've learn't (there's...
Continue reading

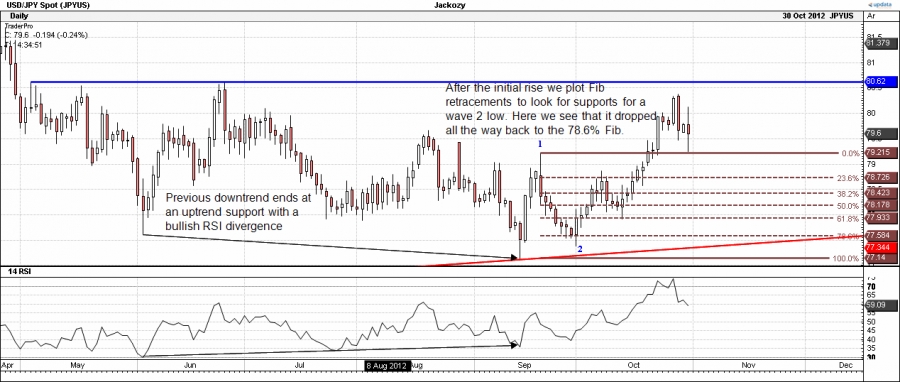
Here we're going to look at a live example of this theory in action. Prices almost never perform precisely to TA theory so please view this post as educational rather than a trading tip.
USDJPY had been in a downtrend which ended at a known uptrend support with a bullish RSI divergence. We've seen an initial rise and retrace so we can see how the theory matched up:
dl.dropbox.com/u/20815047/USDJPYexample1.gif
We can see it dropped to the 78.6% Fib so we plot the Fib extensions from there to give us resistances on the way up to a wave 3 target:
dl.dropbox.com/u/20815047/USDJPYexample2.gif
We have not (so far) reached that target so the rest is theoretical. The wave 3 target from the Fib extensions comes in very close to a known, strong resistance level so it seems a good place to trade from. We can then theorise as to how the rest of...
Continue reading
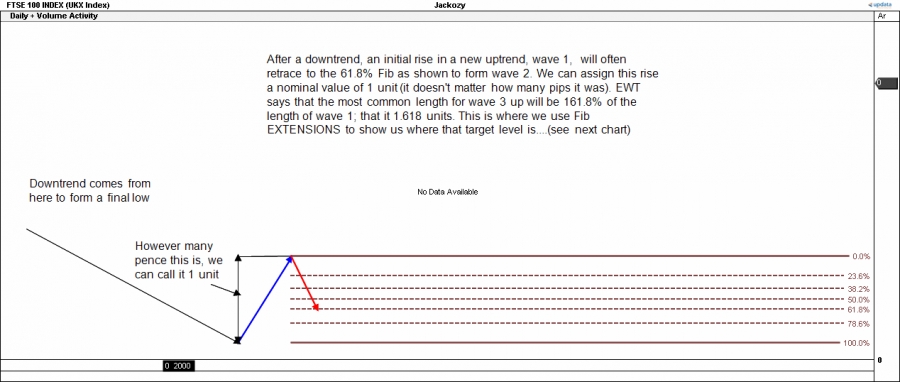
Here we have a sequence of charts showing a theoretical 5 "perfect" Elliott Waves up.
We start by assuming the share has been in a downward trend, forms a final low and then begins a new trend up with wave 1:
dl.dropbox.com/u/20815047/EWTwaves1%2C2.gif
This wave 1 up ought to also consist of a sequence of 5 smaller degree waves up but we'll leave that for now. The main point here is that the initial wave 1 up will often be followed by quite a severe retracement, usually to the 61.8% Fib level. This is thought to be due to the collective psyche still being unsure about the new trend causing many to take profits early having been trapped in the previous downtrend.
Following this retracement, price begin to look quite cheap again near to the previous downtrend low and traders buy this level since it represents good value compared to all of...
Continue reading