


This is an update to the Interesting Chart section on www.chartsview.co.uk, this section is updated every week and provides shares that have great potential for the coming weeks. In this blog I will be looking at how well these tips have done by showing you the before and after picture.
This blog is not updated every week as some times the shares may breakout the following week and therefore it's pointless to just show 1 or 2 breakouts every week. These past 2 weeks have been a bit slow as only seven shares have broken out, there has been better success with the currency and index trades mentioned in the forums and a few shares that were not part of the interesting chart section.
Currency or index trades are not included in the interesting chart section as they change daily and need closer attention. The interesting chart section is only focused...
Continue reading

ChartsView Blog:
- Subscribe to this category
- Subscribe via RSS
- 252 posts in this category
This is an update to the Interesting Chart section on www.chartsview.co.uk, this section is updated every week and provides shares that have great potential for the coming weeks. In this blog I will be looking at how well these tips have done by showing you the before and after picture.
The interesting chart section needs to be looked at on a regular basis as some times the companies that have been put up only move or brake out a few weeks later. It can be hard to go through all the charts but for people that have MetaStock or any other professional charting package it would be easier to keep track, as you would just have to save them on to your charting package and view them daily.
Here goes....
18th March 2013
DOM.L
BEFORE This is the chart of Domino's when I mentioned this:
AFTER: This has moved 40 points...
Continue reading
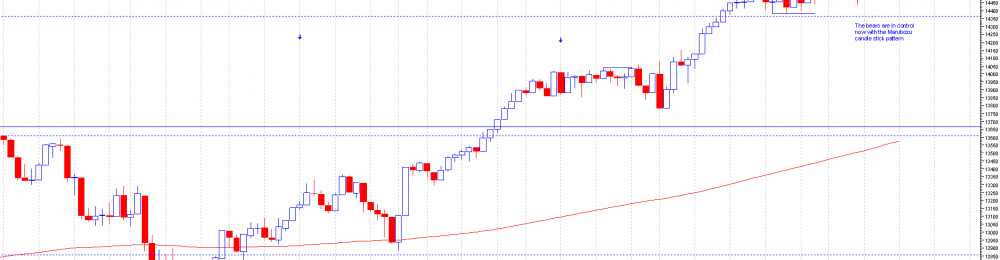
Marubozu candlestick pattern on the dow. This is quite a rare pattern on the dow jones industrial.This shows that the bears are in charge and bigger falls maybe about to come.Go away in april and come back in october may be true this year.A good entry based on this pattern is if the price comes half way up the Marubozu in this case to 14731(this is th 50% point of the Marubuzu) then short with stops above preferably.Caution on new longs as this could be the signal for a top. Obviously if the price goes back above the Marubozu then its void.
Marubozu candle has a long black body(red in my chart) and has no upper or lower shadows. This pattern indicates that the sellers are in charge and is pretty bearish pattern.
Ive noticed a lot of the time prices come back half way up a Marubozu and...
Continue reading

SXX
Click to enlarge chart of SXX
AQP
Click to Enlarge Chart of AQP
QFI
Click to Enlarge Chart of QFI
AEX
Click to Enlarge Chart of AEX
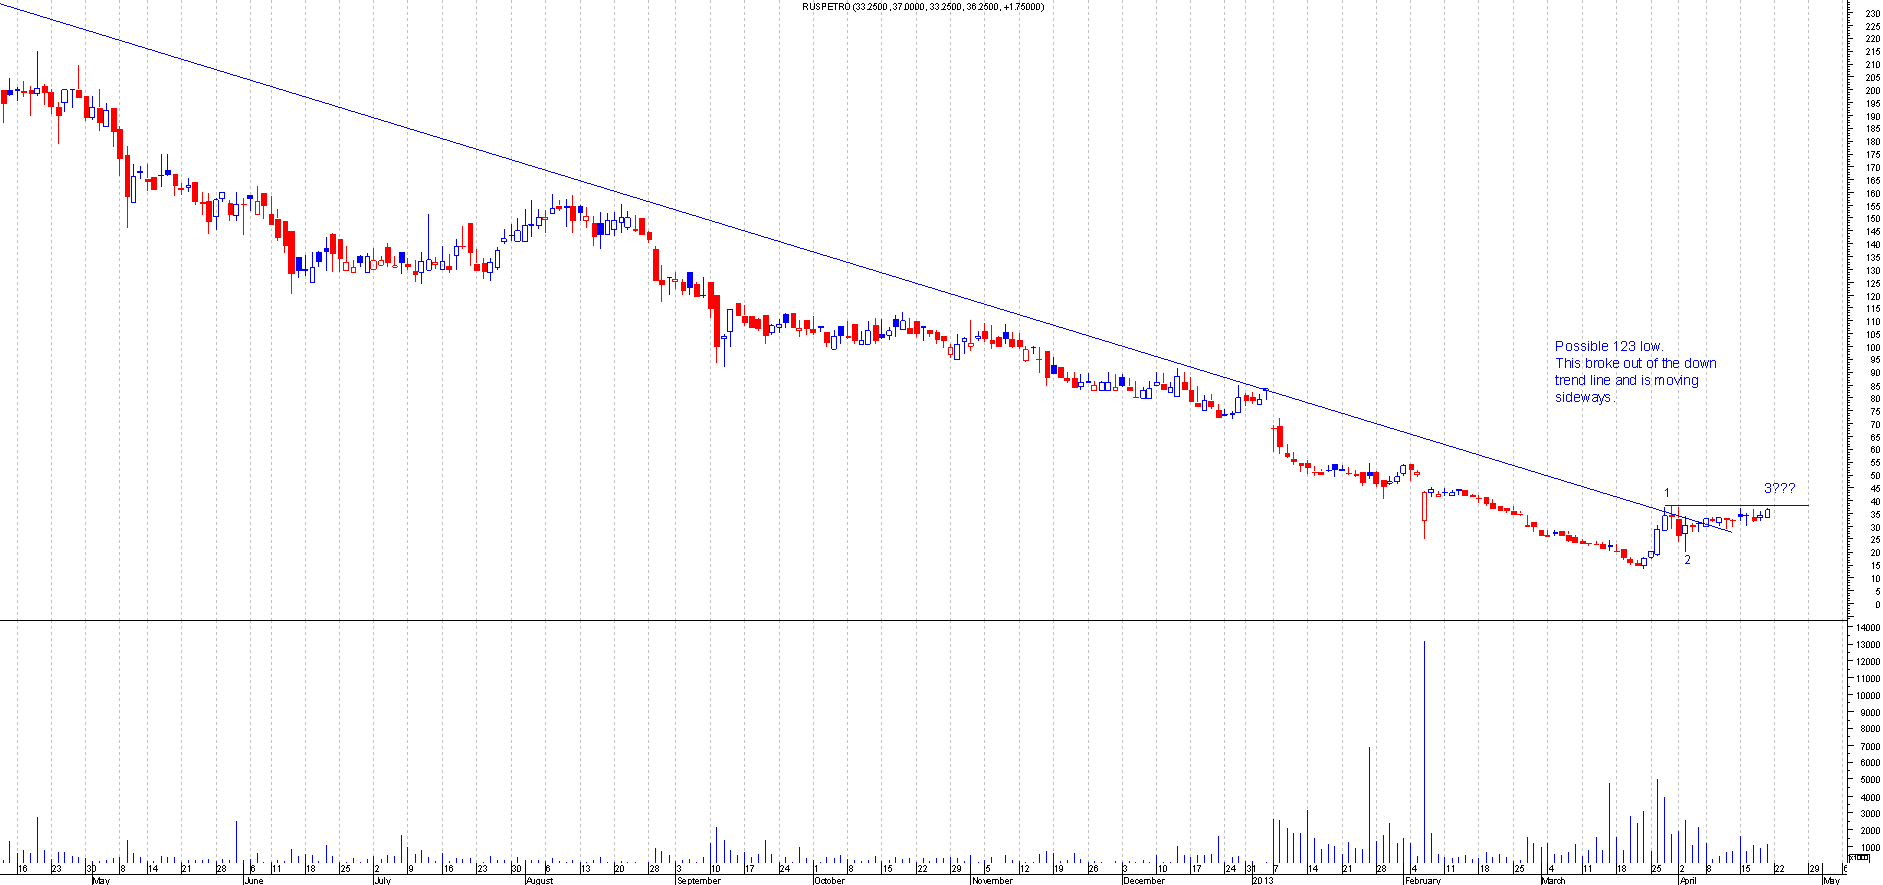
POG
Click to Enlarge Chart of POG
HOIL
Click to Enlarge Chart of Hoil
XTA
Click to Enlarge Chart of XTA
GPK
Click to Enlarge Chart of GPK
GLEN
Click to Enlarge Chart of GLEN
BARC
Click to Enlarge Chart of Barc
WZR
Click to Enlarge Chart of WZR
BLVN
Click to Enlarge Chart of BLVN
pj -my views , catch you next week...
Continue reading

Evening Guys and Gals,So on this entry I think we will take a closer look at the RSI behaviour in a smaller timescale on the EurUsd and see if we can notice any pattern.The first chart will show peaks in an uptrend - and show examples of where it would be a good spot to have went short - and the subsequent behaviour at these levels.The 2nd chart will do the same - except look at peaks in a down trend. Will be interesting to see if the behaviour is the same.So, without further delay - chart 1, this is just the first random period of 3+ peaks I could find on the 1H chart:
From this chart - we can see 3 of the 4 peaks identified have clear bearish divergence. 2 of the 4 were on the 3rd RSI peak, with the other being less clear.1 thing I...
Continue reading
