Hey guys and gals,I'm writing this blog for 2 main reasons -
1. to test the new, easier to use Blog interface, and
2. to go through some random charts with the aim of looking at the RSI more closely - also to find out the correlation between the RSI and EWT - if indeed there is a strong links In order to do this with no bias other than the assumptions I already have, I am literally going to pick out random charts, aswell as different timelines in order to see if there is any pattern that can be identified.** Note - some or most of you will probably already know or understand any correlation or patterns identified with RSI/Divergence/EWT - but I feel this could be a beneficial exercise for me regardless, and no harm can come of it I imagine. I am also testing out the blogging software as...
Continue reading

ChartsView Blog:
- Subscribe to this category
- Subscribe via RSS
- 252 posts in this category


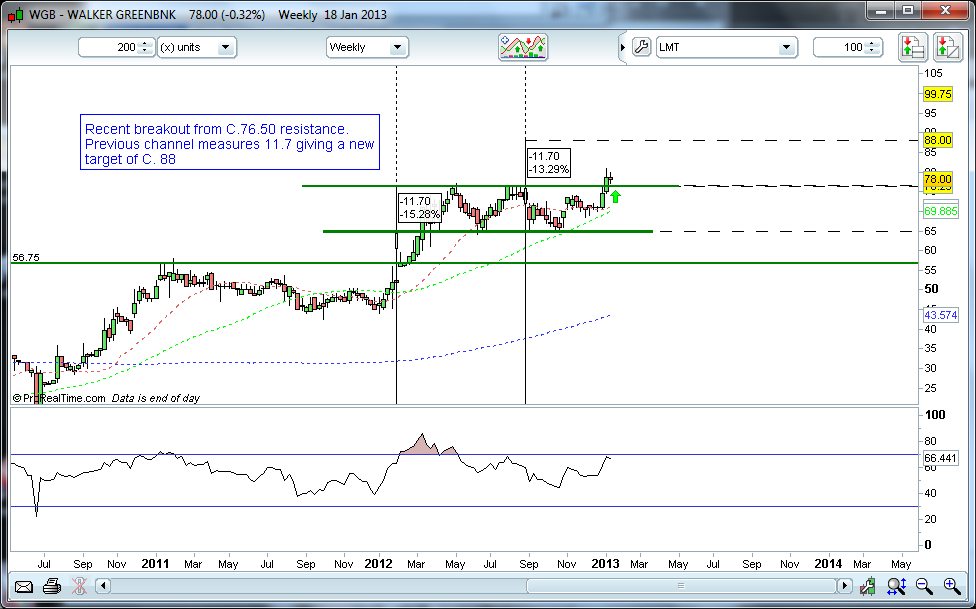
Interesting charts update
Last weeks interesting chart section had a very good week, with many of them breaking out and moving higher. A few of them were false breakouts but still should have profited from the inital thrust. I'm not putting all the charts up but only the ones that have moved higher. There were 12 shares to watch out for and 6 of them moved higher so should have been a good week for some who took the trades.
Starting with ABF.L( Associated British Foods)
This share broke out of the triangle and continuation pattern.
Before the breakout:
After the breakout:
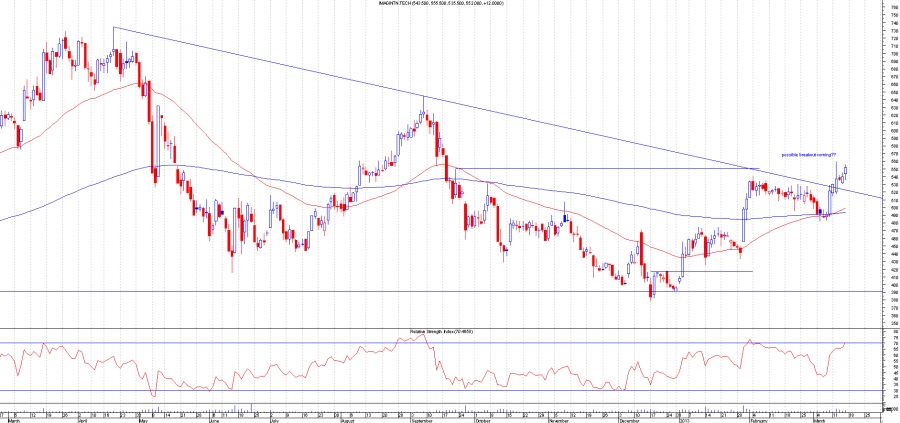
BG.L (BG Group)
This broke out nicely and now is re-testing the breakout point. If this goes back below the new support then chances are it would be a false breakout. Profits should have been taken on this share.
Before the breakout:
After the breakout:
BRBY.L(Burberry Group PLC)...
Continue reading
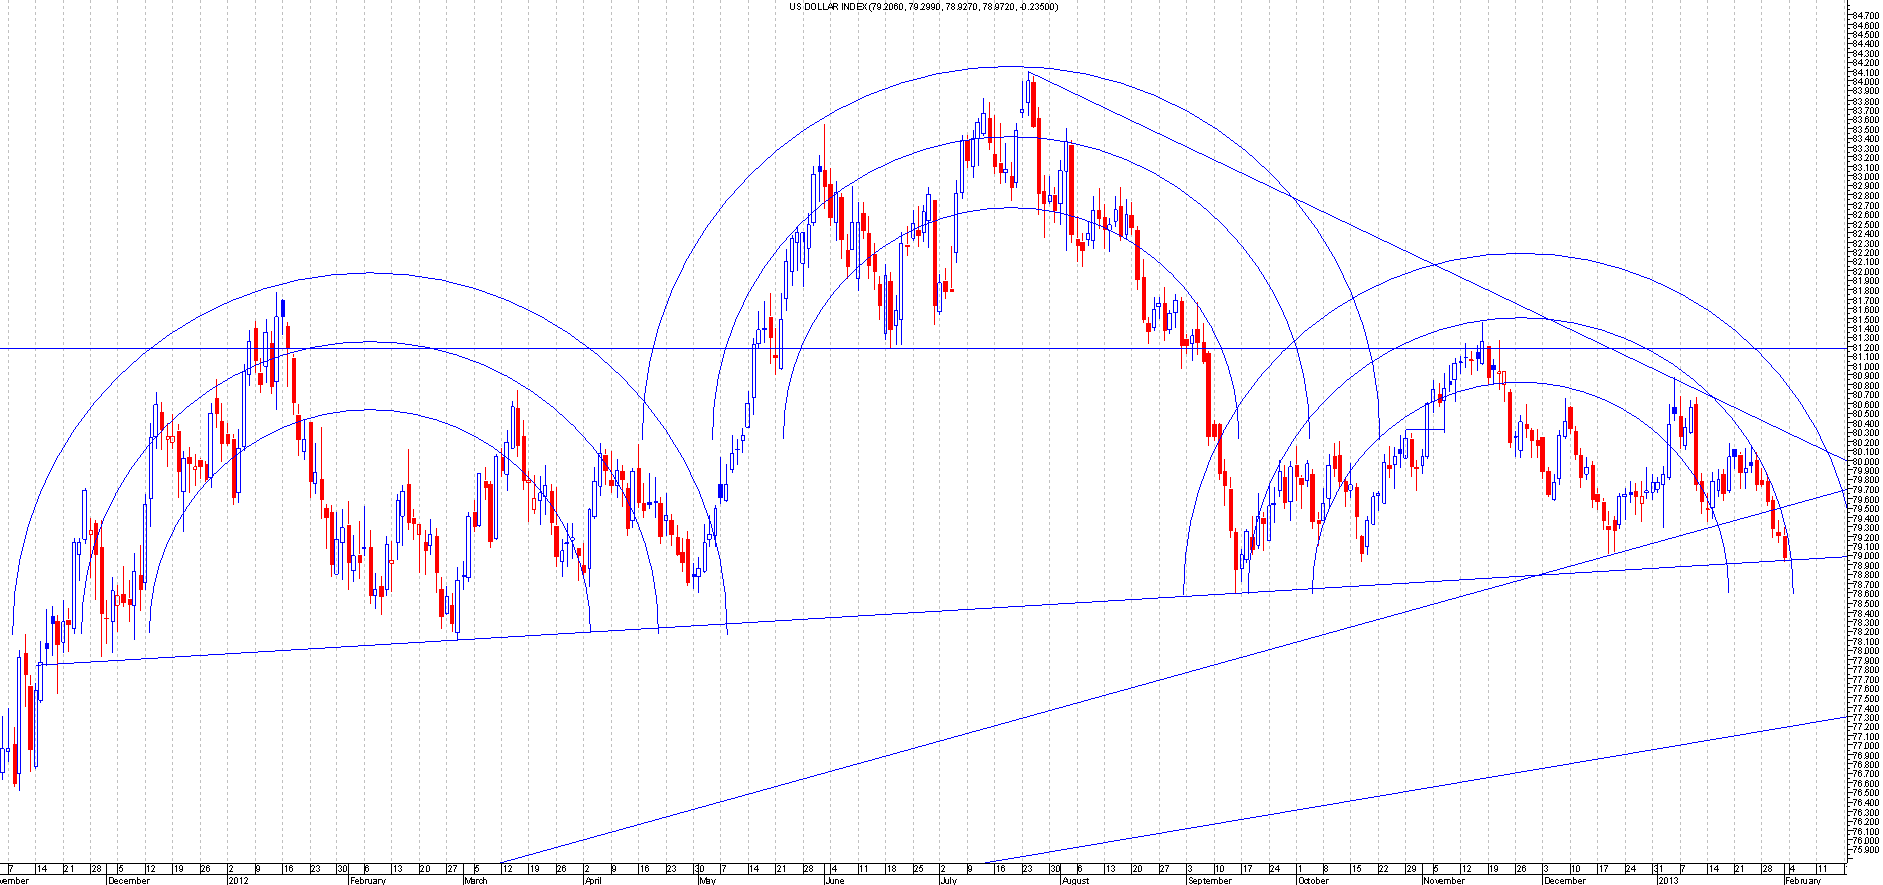
I always have a look at this index when trading against the dollar. This give you the overall picture of the US Dollar against all other currency.Short term it looks like the dollar has broken a short term trend line which has led to the test of the neckline on a head and shoulders pattern which is pretty big. It's currently bounced of that neck line as of 3rd feb.So if your betting on the dollar to be the stronger pair then be careful as if that neckline support breaks then the head and shoulders top comes into play and which could mean the dollar falls a lot lower against most currency .
So one to watch over the coming days.
Close up view
If you look closely there is another head and shoulder formation on the close up chart as well. So there's a...
Continue reading
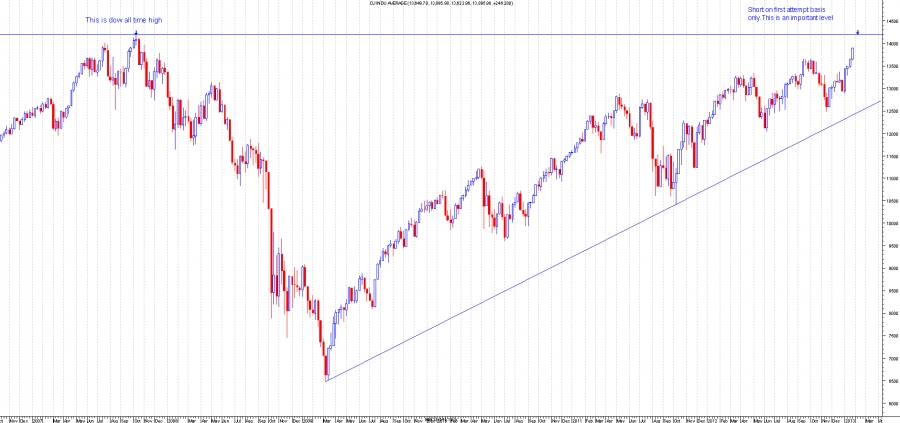
The Dow Jones Index is approaching a very important level
The Dow Jones (Dow) is approaching its all time high and this level is an important level as everyone knows that this is the highest the Dow has ever reached. I would be very surprised if the high got taken out on the first attempt, so for this reason I would short the Dow at 14198 with a 40 point stop during market hours only.
I won't short this level if the Dow closes very near to this level from the previous day, the attempt should be from a far away distance like 100 points away. Whenever it closes near a major resistance then the chances of a breakout are higher so hence why this trade should be done from a far away basis only.
Another reason for the short is due to the double top possibility whenever I see a share or index approach...
Continue reading
Hey guys,
Thought I would give this blogging thing a go for the first time!
After reading so many good blogs and posts, it cannot help but inspire me to try the same. The worst I will do is learn, the best I can hope for is to give someone a trading idea for the upcoming week or months.
Right now as it stands, I look at alot of charts, I annotate most of them, but only post a few on the board. This means that alot get lost in files never to see the light of day again - but if I start posting these charts to get laughed at, I can at least track their progress and determine whether or not my thoughts are along the right track more often than not - or vice versa.
I am hoping the charts speak for themselves - to save you lot...
Continue reading