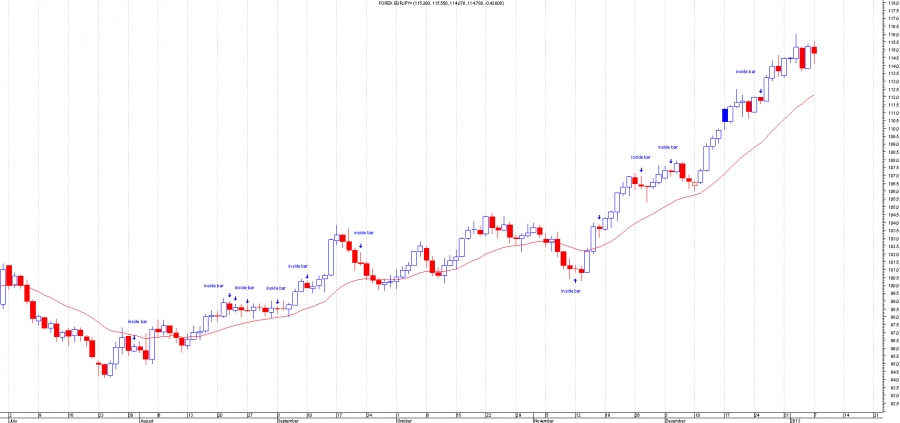
This blog is basically an overview and update on my experience of using the inside-bar trading system, which I have been using for the past two months. I am very new to trading and wanted to try out a trading system rather than trade on my own. There are many trading systems out there so it was hard to decide which one to go for initially. However, I wanted to try one that was simple, easy to follow and one that wouldn't take up too much of my time and these are the reasons why I chose to do the inside-bar trading system.
This system basically involves looking for an inside-bar, which is a bar contained within another bar or candle. Once you find one you then look at the 21(EMA) moving average, if the average is pointing up you would go long about 3-5 pips above the high...
Continue reading

ChartsView Blog:
- Subscribe to this category
- Subscribe via RSS
- 252 posts in this category

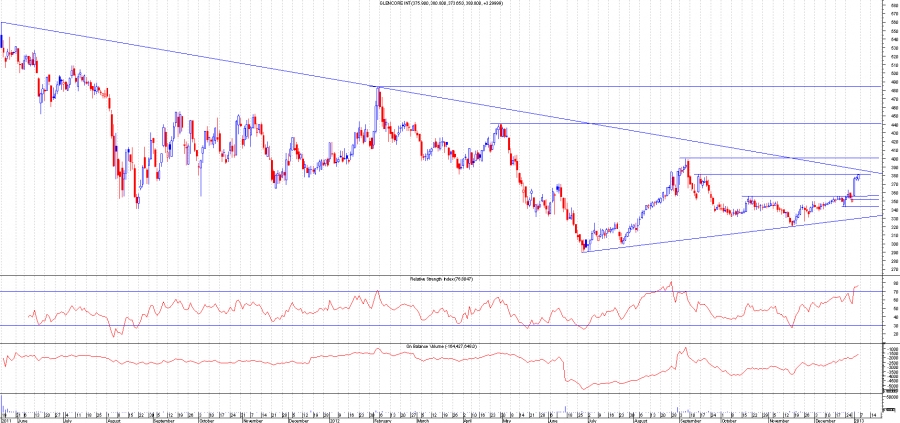
Glencore is heading towards the main down trend line. If this can finish above this then prices should go higher.It will signal an end to the down turn in Glencore shares .
Glen has been in a bear trend since it floated on the ftse100 so this trend line will be very important for this share to go higher. This has to finish above this
trend line on an end of day basis for higher prices to follow. The real test will be if this can finish above the Psychological level of 400.Clearing 400 will also be
the first true higher high since floating.So next week should be interesting for this company.Its had minor higher highs but the 400 level is in my opinion the
one that needs to be broken.Its a significant high so hense why i give it importance.
Ill try and put interesting charts up every...
Continue reading
Recent Tips on ChartsView Update
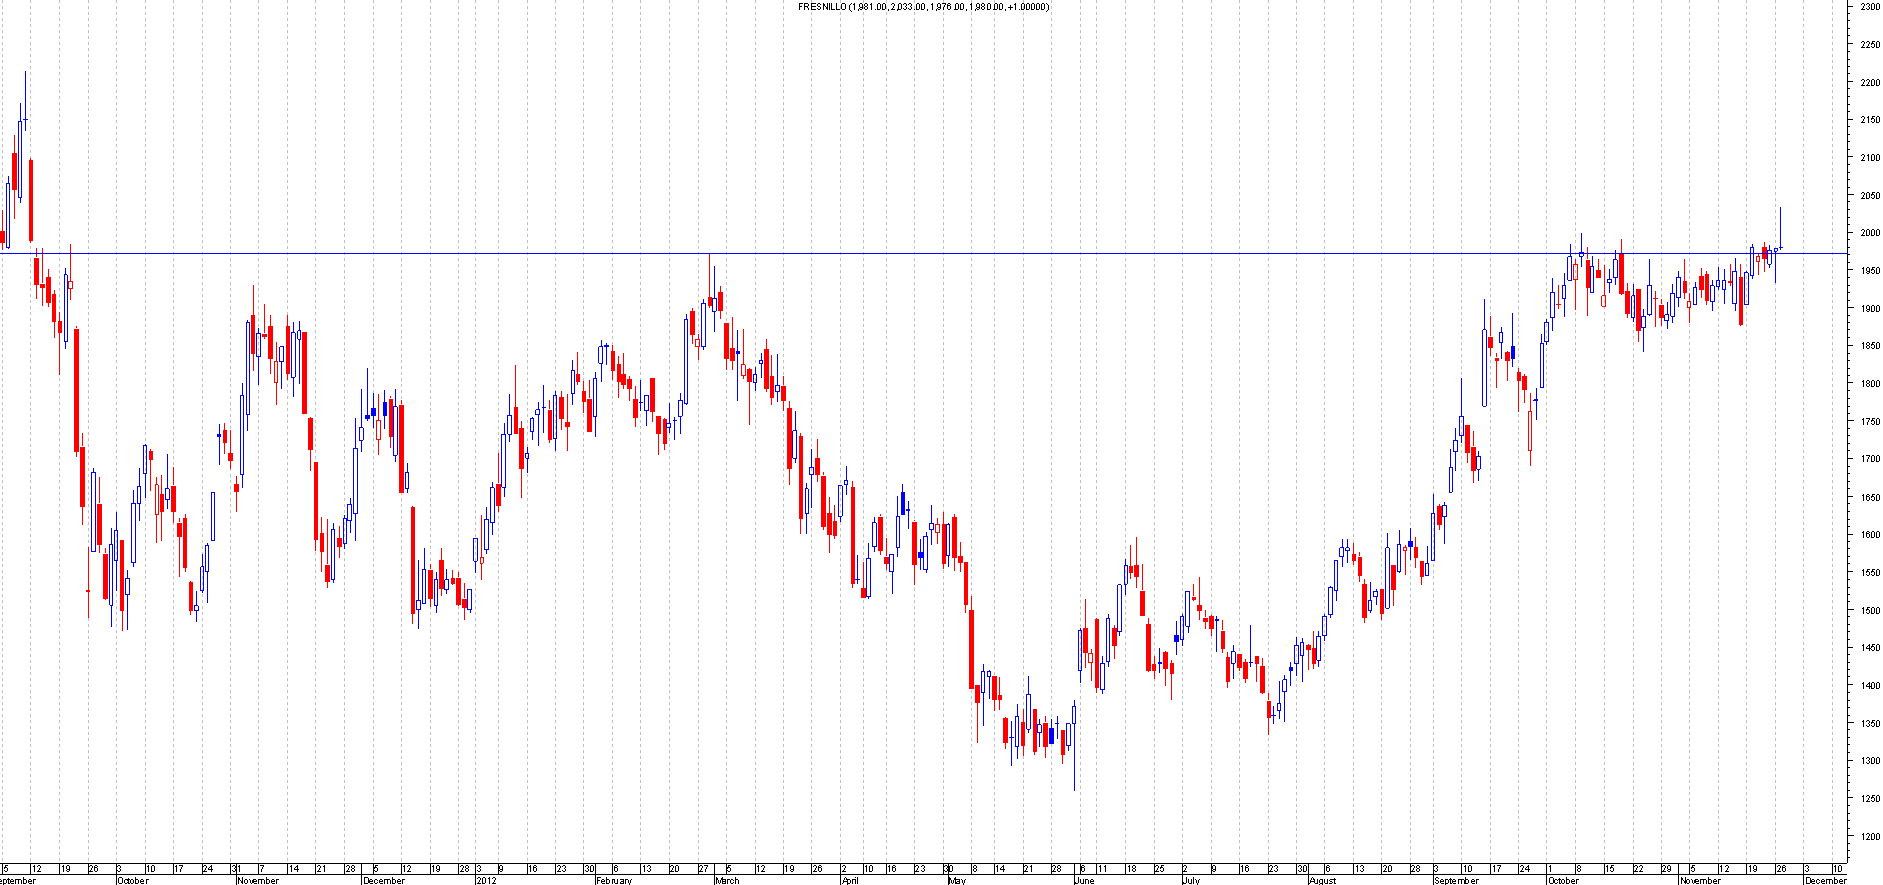
Fresnillo: FRES.L
This was tipped on the 28thnov for a short. The entry would have been half way up the shooting star with a stop above.
Entry 2004
Stop above 2033
https://dl.dropbox.com/u/4899609/fres27thnov.png
This is where it is now
This is currently 145 points in profit so should be a free trade.
https://dl.dropbox.com/u/4899609/fres29th%20dec.png
Randgold Resources :RRS.L
This was tipped as a short on 13th nov with a rounded top formation and a trend line break and a gap down. Target was 1100 points lower
https://dl.dropbox.com/u/4899609/rand13thnov.png
This is where it is today
This is currently 800 points in profit so now is a free trade
https://dl.dropbox.com/u/4899609/rrs29thdec.png
Tullett Prebon : TLPR.L
This was recommended by board member ftse80 a few weeks earlier.
This was tipped on 11th dec with a 123 low breakout.So a Buy.The breakout point was 229
Stop below the 2 point on the 123 low...
Continue reading
Nothing beats manual scans.Scans from a charting software also work if your looking for a particular type of pattern.To look through the ftse100 companies manually takes me about 5-10 mins.The reason i can do it so quickly is down to my software i use(metastock)and also my knowledge Metastock stores every change you do on a chart automatically. So if i drew a trend line it will always be there until i remove it.Same for support and resistance lines.So any thing i draw will automatically be saved on a live chart. This is a great feature as i dont have to save a watchlist as such.So if i manually go through the ftse 100 companies i dont have to keep drawing the trend lines as they will already be drawn so i can tell when a company is approaching a trend line if i manually scan every day.This is the main reason i...
Continue reading
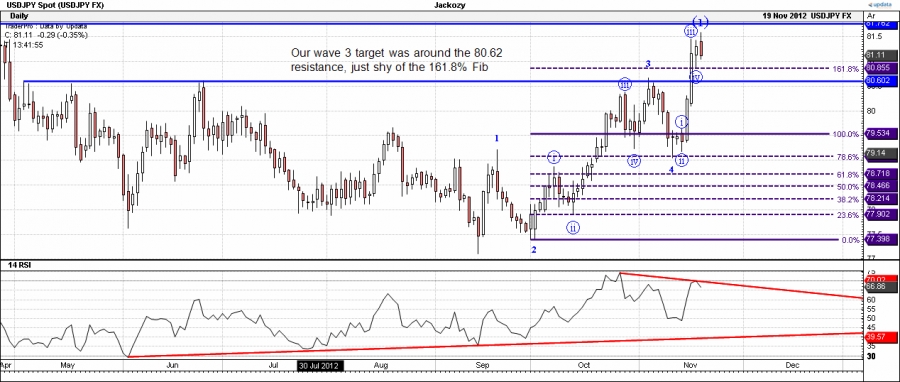
Here's a follow-up to the earlier piece on the USDJPY live example for the EWT/Fib theory.
Remember, we were looking at a 161.8% Fib extension target for wave 3 up at 80.85 but we knew there was firm resistance at 80.62 which would probably come into play. We were then looking at a possible retrace to the wave 1 high at 79.22 for the wave 4 retrace before continuing up to test the 81.78 reistance for wave 5. Here's what happened:
dl.dropbox.com/u/20815047/USDJPYdaily19_11_12a.gif
As we can see, that resistance came into play perfectly with a bearish RSI divergence too so this was a good place to go short. The wave 4 down turned out to be slightly anomalous though:
dl.dropbox.com/u/20815047/USDJPYdaily19_11_12b.gif
We were looking to the 38.2% Fib or the top of wave 1 to act as support. In fact it retraced to precisely the 50% Fib which entered wave 1...
Continue reading