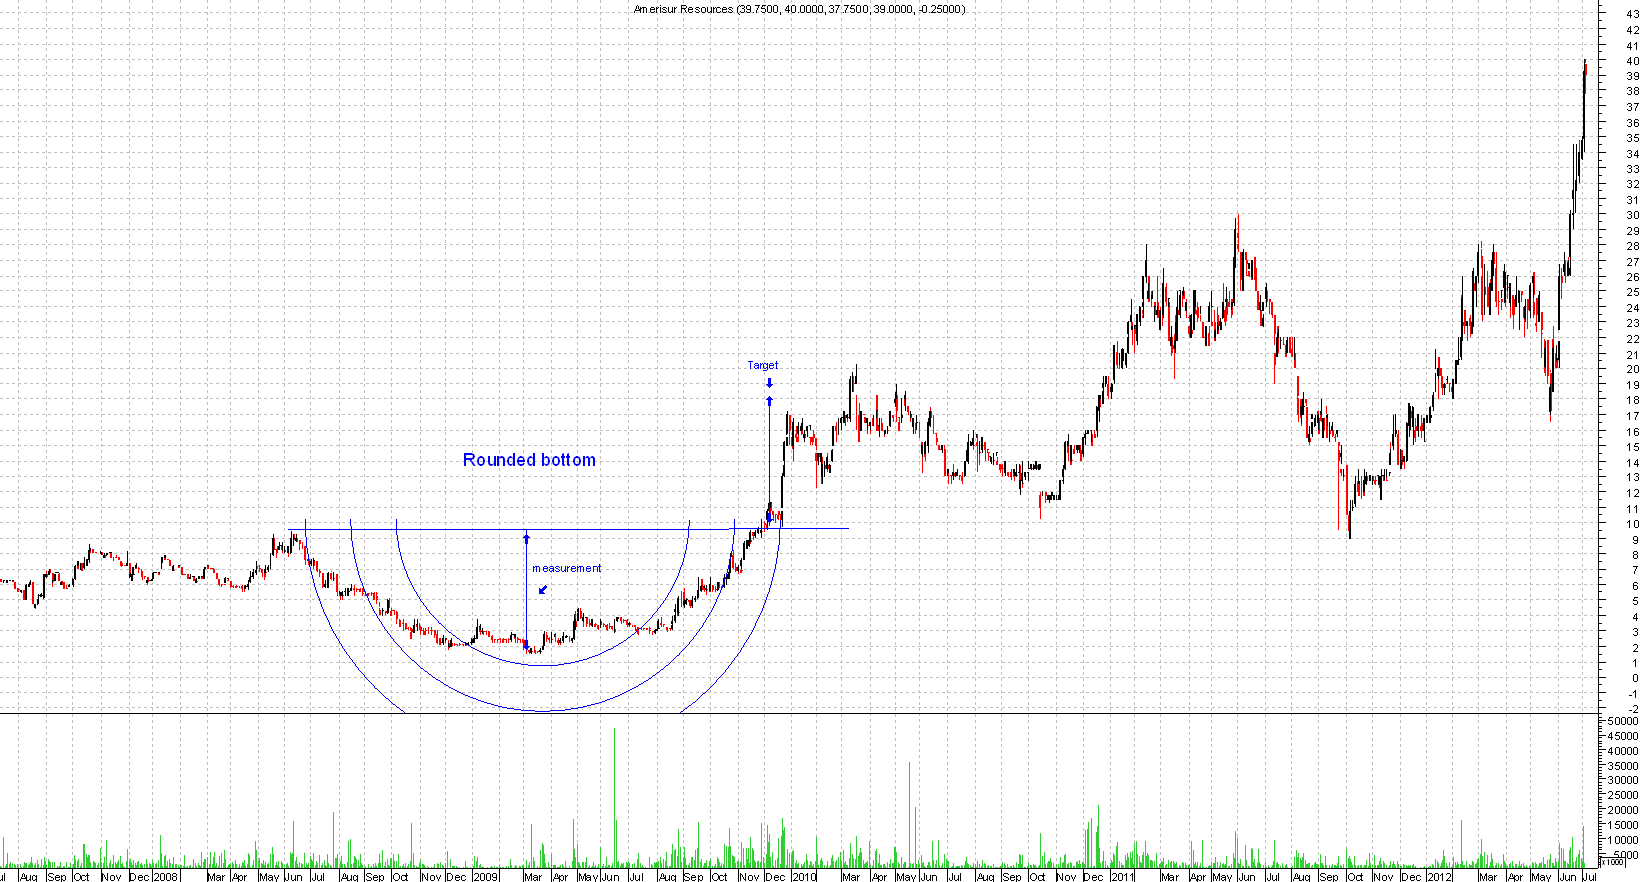
This basically is a slow downward move followed by sideways move then upwards. This takes the shape of a cup(without the handle).
This pattern can take some time to develop. Once it's got the shape of a nice cup then draw a line though the peaks of the cup and once the price breaks above the peaks of the cup you will get your buy signal.
You can measure the distance of the target, measure from the top of the cup to the bottom then you project that line from the breakout point, you then have your target.
Please click on chart below for larger image
...
Continue reading
Chartsview blog
General trading and all to do with financial markets

remo
Been trading the markets for more than 20 years and learnt the hard way to trade.
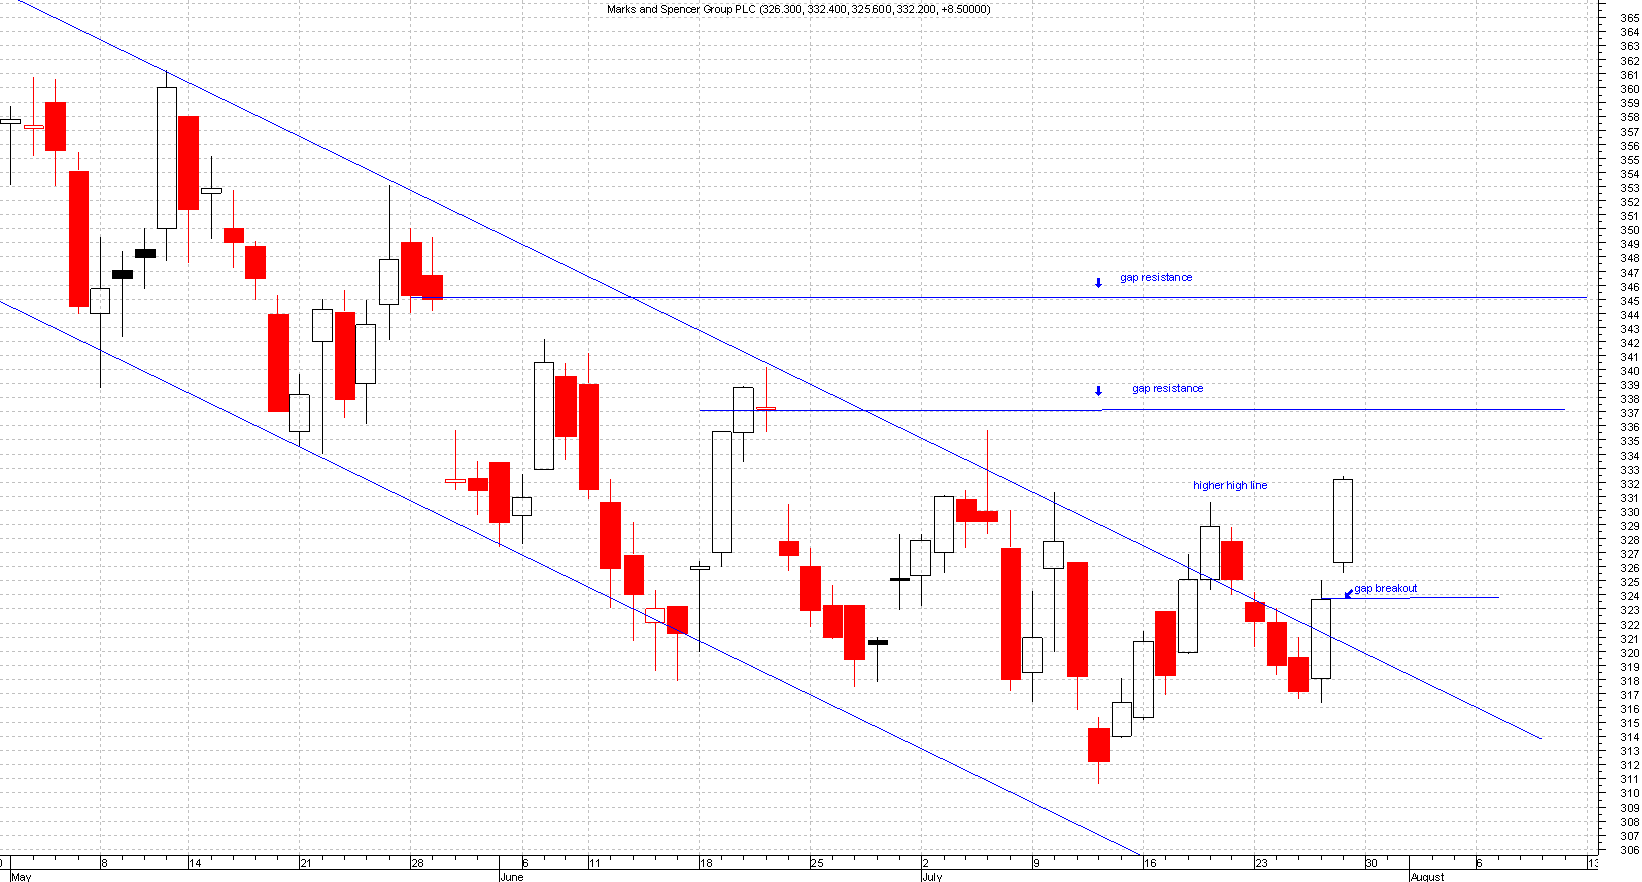
Gaps occur when a price chart opens higher (or vice versa) than the previous days close. Where no trading has taken place is usually a good time for gap trading to be profitable.
The way to use them is if the trend is up and the price approaches a previous gap then you should go long at the bottom of the gap.
Obviously the opposite is true for a downtrend, gaps are also good for future supports and resistances.
There are 3 types of gaps:
Breakaway gaps
This forms at the beginning of a major move, like after a range bound breakout. It should also have high volume attached to this.
Please click on the chart below for larger image
Runaway Gaps
This happens during a rally or after a few days of sustained up or down moves. Prices will gap forward to form a runaway gap.
This is a...
Continue reading
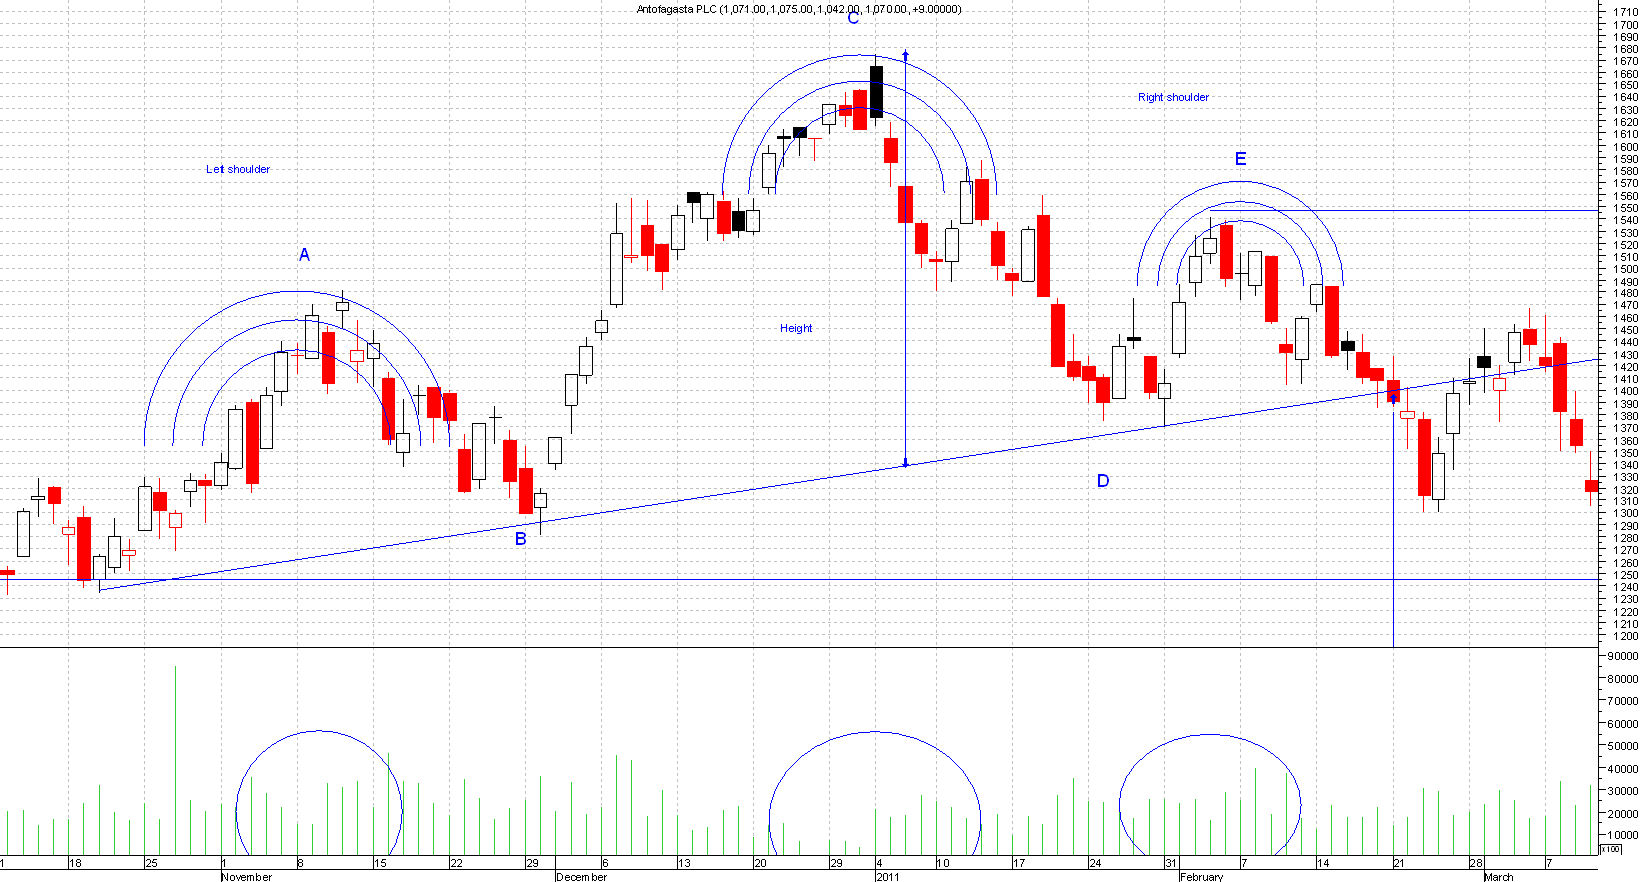
This is by far the most famous and popular charting pattern. This pattern consists of a left shoulder, head and a right shoulder.
The head and shoulders appears at the top of a trend and nowhere else.
Please click on the chart below for larger image
The build up of the left shoulder maybe accompanied by higher than normal volume, point A, then a retrace point B, this will normally be of low volume.
Then you have a rally to point C, this is the head forming. This could be light volume, this passes point A (left shoulder) and then a retrace to point D.
This decline goes lower than point A(left shoulder), at this stage you could get an idea of what's forming. The peak of point A should have held as support so alarms bells may start ringing at this point.
Then you have a rally to point E(right...
Continue reading
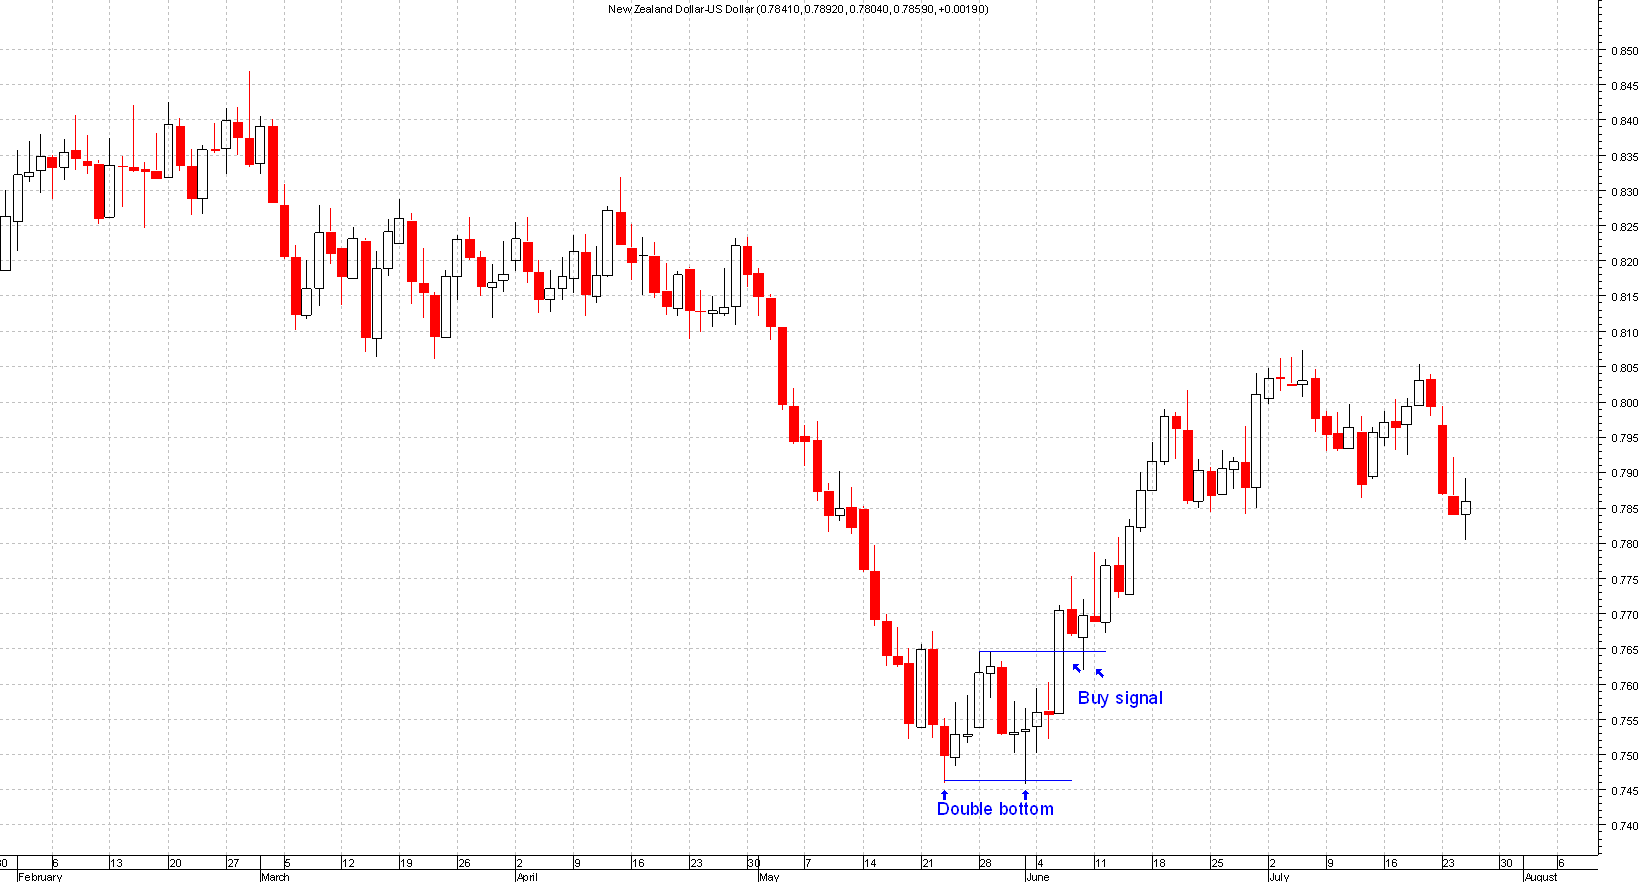
This is the opposite of the double top (see double top article), like most technical patterns the 2 peaks don't have to be spot on but close enough by a few points.
This pattern has 2 similar lows then followed by a rally, the break of the middle peak should have higher volume associated with this to generate the buy signal.
Stops should be below the double bottom but the problem with this is that it could be a big risk if it's a few hundred pips away, so risk management should be incorporated with all stops.
Please click on the chart below for larger image
NOTE
When trading double tops or bottoms be very careful as these patterns are really common.
You do get a lot of false signals with these trades due to the fact that in an downtrend prices always reverse after a peak and then...
Continue reading