Chartsview blog
General trading and all to do with financial markets
Gaps
in ChartsView Blog:- Font size: Larger Smaller
- Hits: 20538
- 0 Comments
- Subscribe to this entry
- Bookmark
Gaps occur when a price chart opens higher (or vice versa) than the previous days close. Where no trading has taken place is usually a good time for gap trading to be profitable.
The way to use them is if the trend is up and the price approaches a previous gap then you should go long at the bottom of the gap.
Obviously the opposite is true for a downtrend, gaps are also good for future supports and resistances.
There are 3 types of gaps:
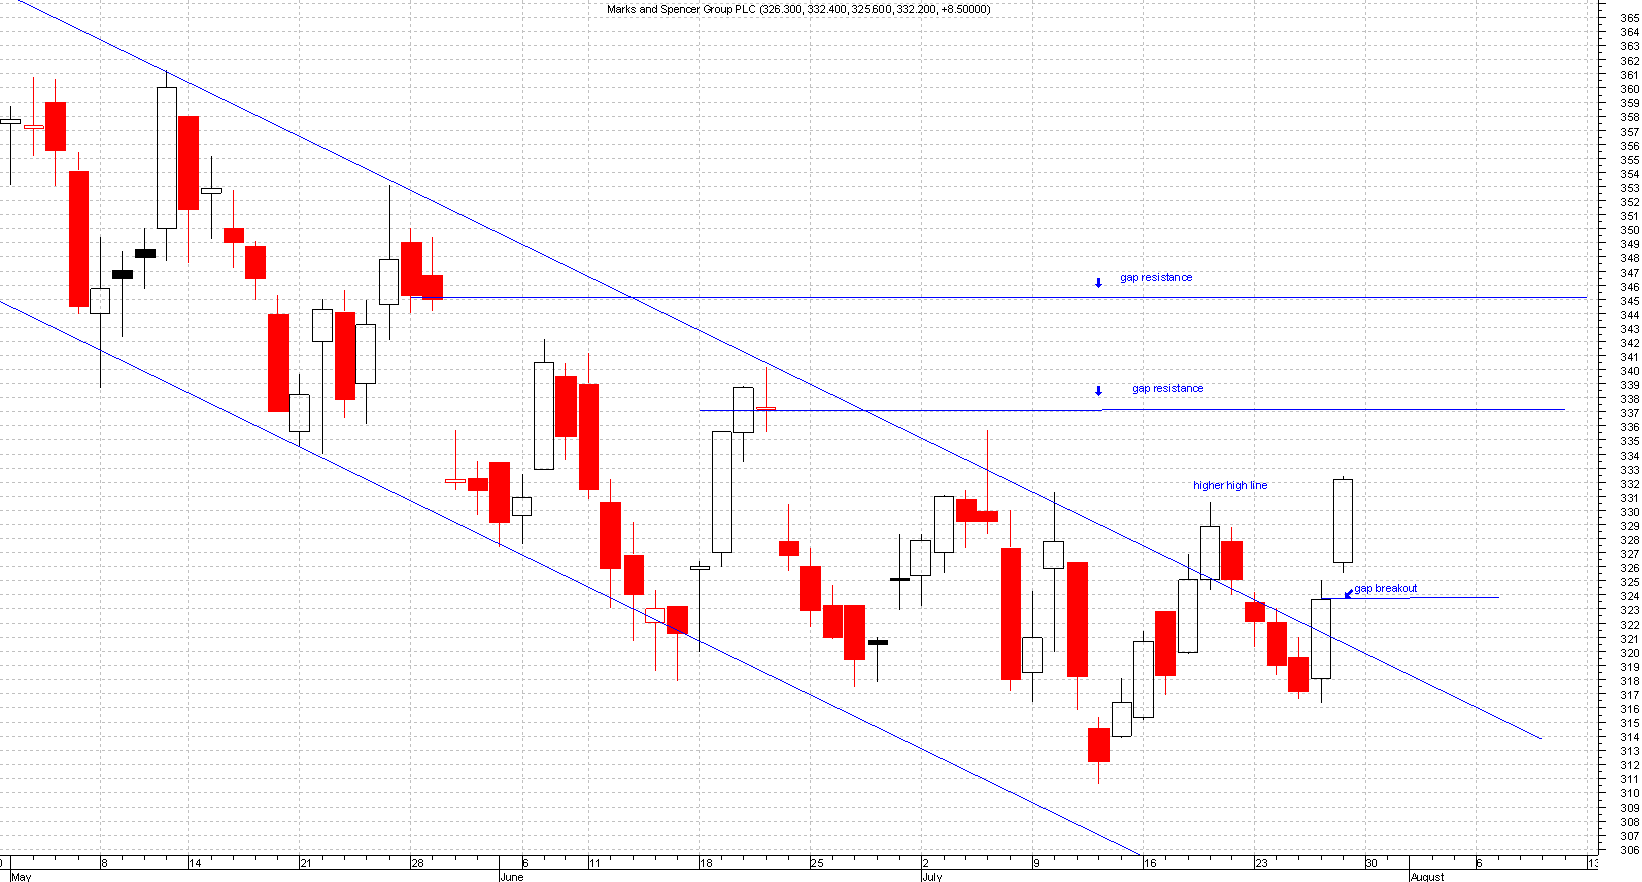
Breakaway gaps
This forms at the beginning of a major move, like after a range bound breakout. It should also have high volume attached to this.
Please click on the chart below for larger image
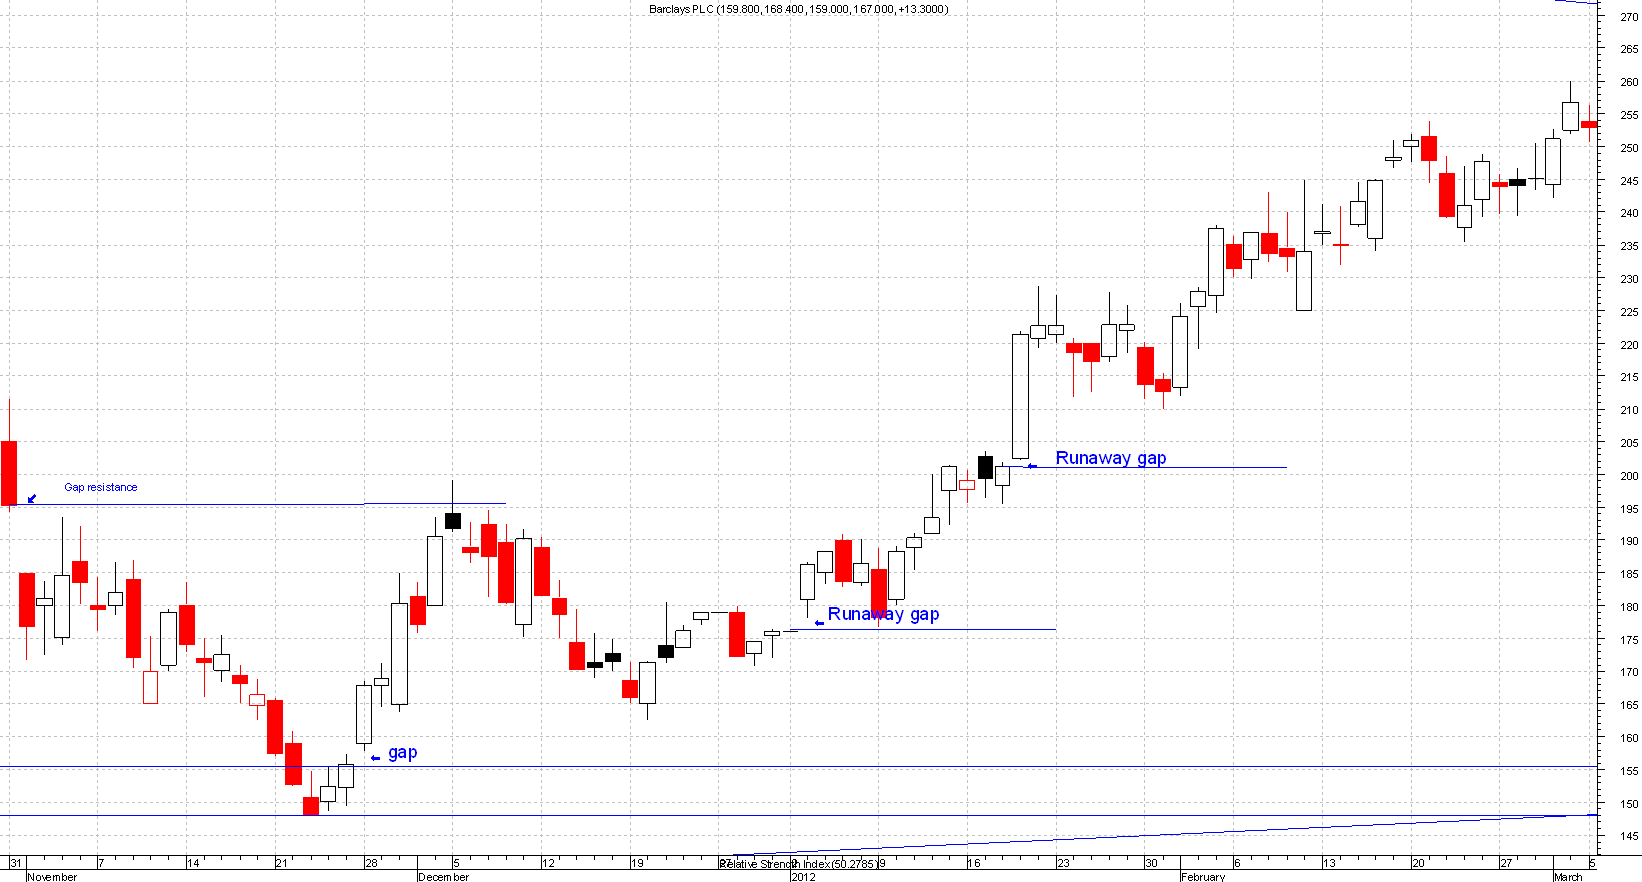
Runaway Gaps
This happens during a rally or after a few days of sustained up or down moves. Prices will gap forward to form a runaway gap.
This is a sign of market strength, or weakness depending on direction. Also worth noted is that when a correction happens and we are in an uptrend, the gap becomes a good level to top up on.
The bottom of the gap acts as support and the reverse is true of a downtrend.
Please click on the chart below for larger image
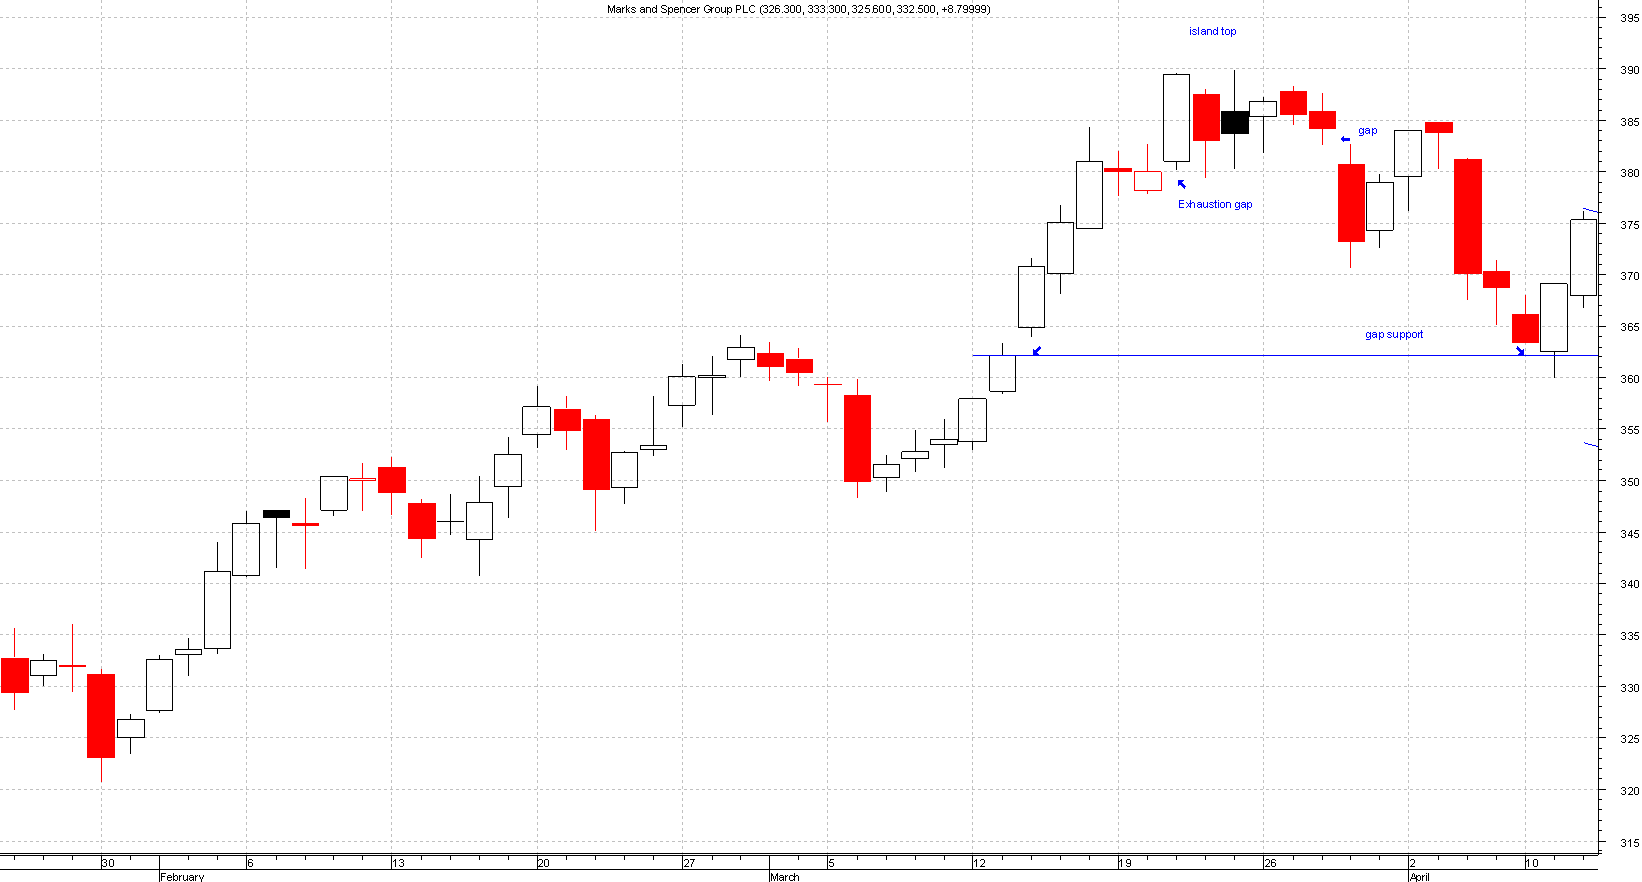
Exhaustion Gap
This comes at the end of a rally and signals a change. This can be identified by a close of the gap within a few days of the gap forming. This can be an early indication of possible tops or trend change.
Please click on the chart below for larger image


