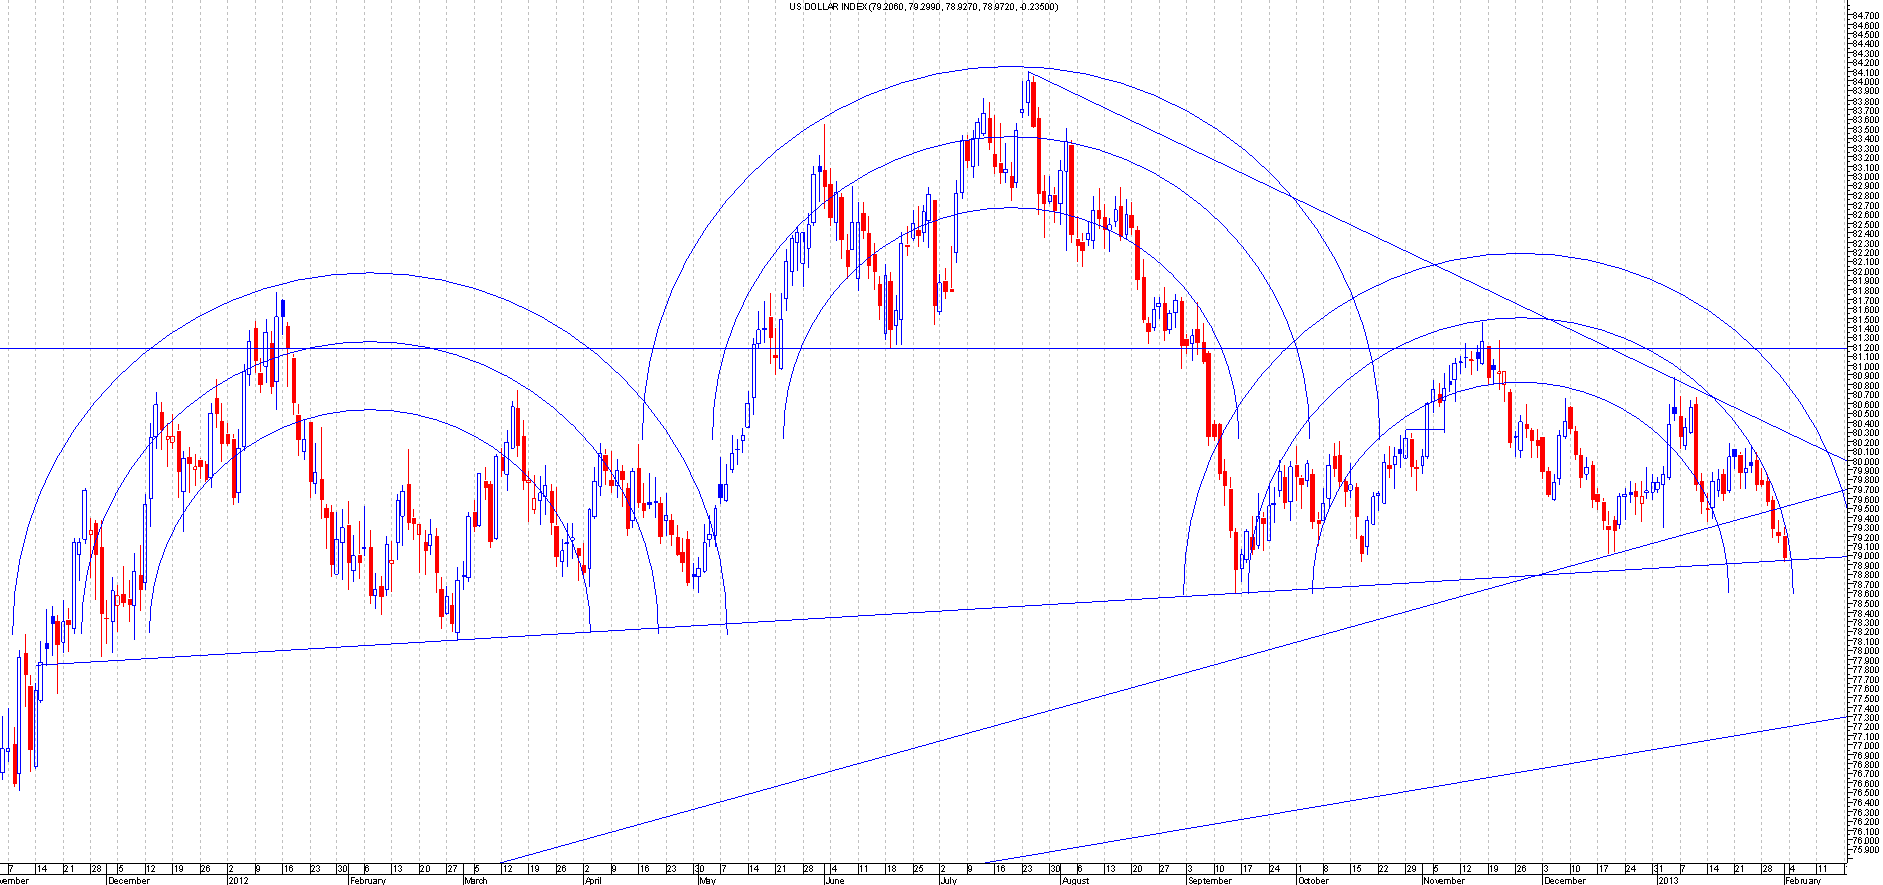
I always have a look at this index when trading against the dollar. This give you the overall picture of the US Dollar against all other currency.Short term it looks like the dollar has broken a short term trend line which has led to the test of the neckline on a head and shoulders pattern which is pretty big. It's currently bounced of that neck line as of 3rd feb.So if your betting on the dollar to be the stronger pair then be careful as if that neckline support breaks then the head and shoulders top comes into play and which could mean the dollar falls a lot lower against most currency .
So one to watch over the coming days.
Close up view
If you look closely there is another head and shoulder formation on the close up chart as well. So there's a...
Continue reading
Chartsview blog
General trading and all to do with financial markets

remo
Been trading the markets for more than 20 years and learnt the hard way to trade.
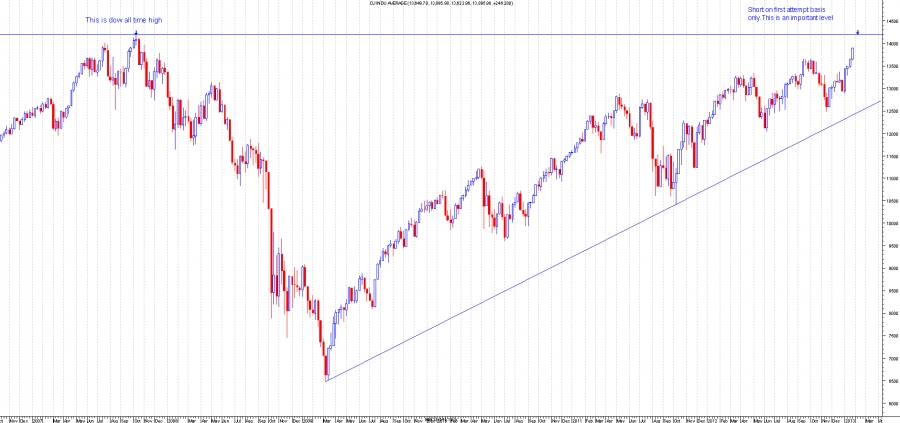
The Dow Jones Index is approaching a very important level
The Dow Jones (Dow) is approaching its all time high and this level is an important level as everyone knows that this is the highest the Dow has ever reached. I would be very surprised if the high got taken out on the first attempt, so for this reason I would short the Dow at 14198 with a 40 point stop during market hours only.
I won't short this level if the Dow closes very near to this level from the previous day, the attempt should be from a far away distance like 100 points away. Whenever it closes near a major resistance then the chances of a breakout are higher so hence why this trade should be done from a far away basis only.
Another reason for the short is due to the double top possibility whenever I see a share or index approach...
Continue reading
This is just for learning purpose.
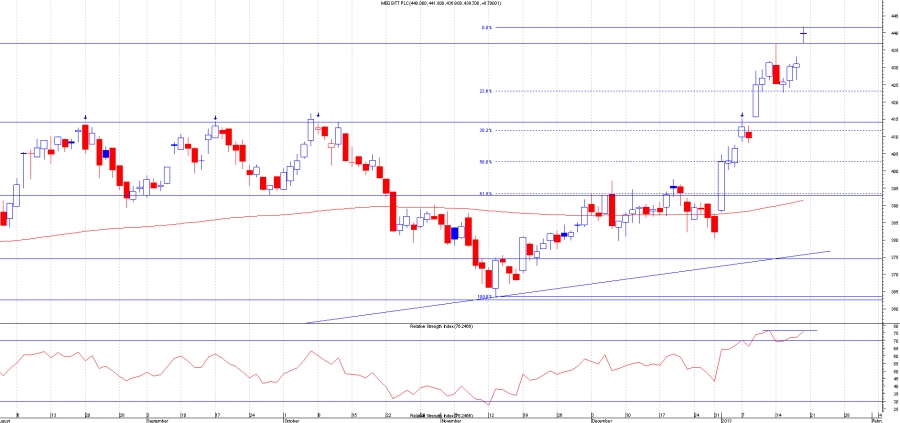
If you look at all those arrows ive put on this chart you can see that the price was held by this strong resistance
Now the price has broken above that resistance level and should be a good support for this share if the price comes back down to it.If you look at the chart then you can also see that the share has gapped up today. Since this share has broken out of resistance it just motored on. This has been motoring since the low on 13th nov. At these levels you should not be looking to buy really as its in no mans land. If you were interested in this share then you would look to buy at support only and the nearest good support is at the breakout point.Now im gonna make some assumptions . Obviously thats all it is but...
Continue reading
Heres some interesting charts that i came across on the ftse 350 today. This is just a brief description
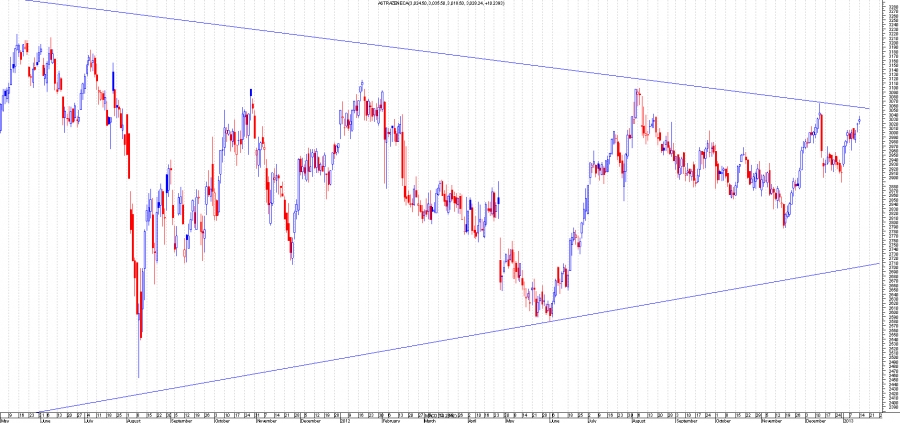
Astrazenica:AZN.L
Good level to go short on this on first attempt basis is 3055 with tight stops
British American Tobacco: BATS.L
If you look carefully you should be able to see the right shoulder forming on a Head and Shoulder formation.
Is this signalling a top maybe forming???
Homeserve:HSV.L
Assending Triangle. This is getting close to the apex now so a breakout may be near.
IMI PLC:IMI.L
Is that a double top ??? Wait for the lower low . or better still the 123 high
Johnson Matthew: JMAT.L
A very rare pattern is forming on this,The Diamond pattern.
A breakout ether way should yield big profits.
Kingfisher:KGF.L
Symmetrical Triangle
Land security:LAND.L
Shooting star right at resistance followed by entry half way up...
Continue reading
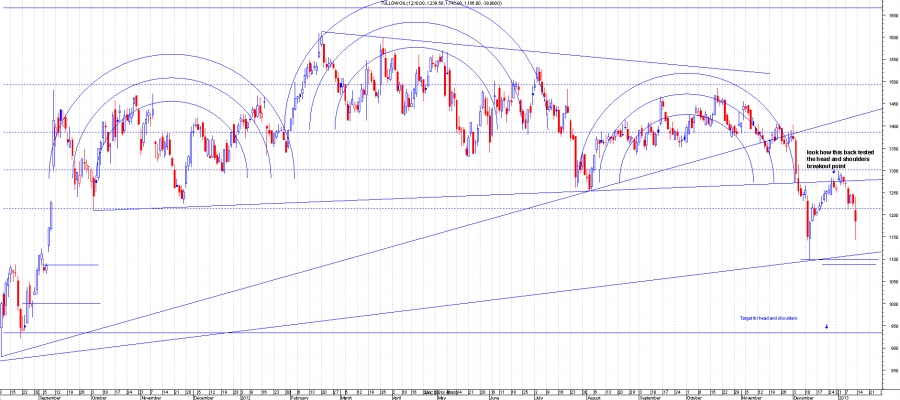
Tullow Oil
This has had a Head and shoulders breakout recently.
This also had the classic back test which was respected. This was a sign of weakness as a confirmation is never a
Good sign. For the head and shoulders to be void Tullow oil has to break above 1300.
This share was tipped on chartsview forum with a short recommendation when the back test was happening.
At the back test there was a shooting star and the signal to go short happened the following day with the price going
Halfway up the shooting star. Stops then would have been above the shooting star. This was the second short attempt at
This level as the first attempt failed on the initial back test as the level for the stop got breached. Then the
Shooting star formed which gave us a signal to look too...
Continue reading