


Chartsview blog
General trading and all to do with financial markets

double bottoms
in ChartsView Blog:- Font size: Larger Smaller
- Hits: 13293
- 0 Comments
- Subscribe to this entry
- Bookmark
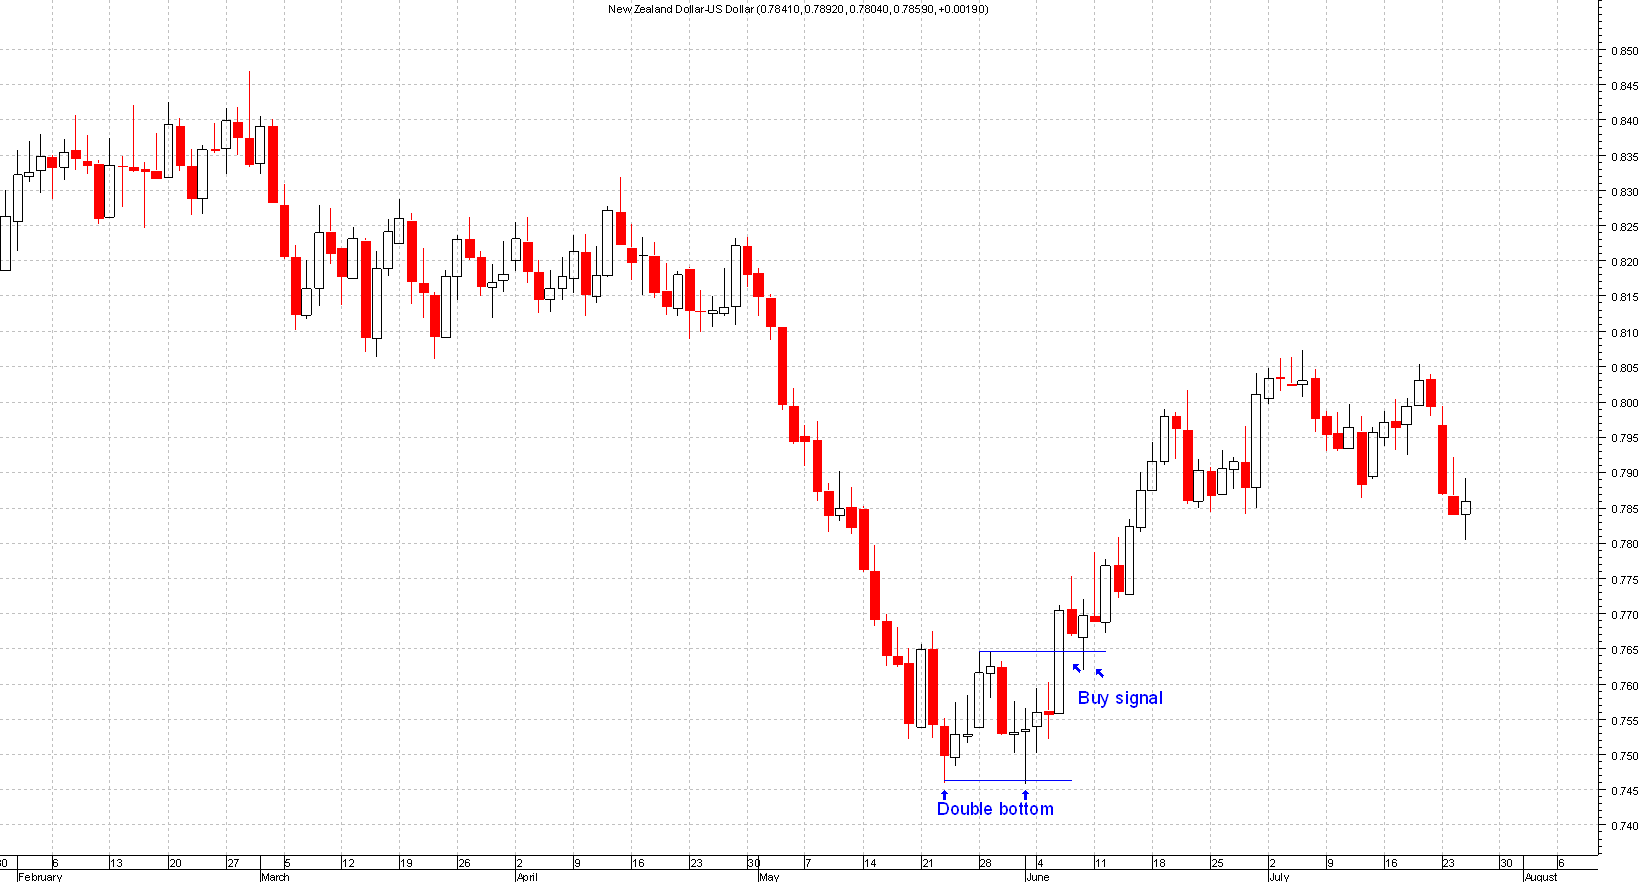
This is the opposite of the double top (see double top article), like most technical patterns the 2 peaks don't have to be spot on but close enough by a few points.
This pattern has 2 similar lows then followed by a rally, the break of the middle peak should have higher volume associated with this to generate the buy signal.
Stops should be below the double bottom but the problem with this is that it could be a big risk if it's a few hundred pips away, so risk management should be incorporated with all stops.
Please click on the chart below for larger image
NOTE
When trading double tops or bottoms be very careful as these patterns are really common.
You do get a lot of false signals with these trades due to the fact that in an downtrend prices always reverse after a peak and then breaks lower, that attempt at the break lower is what causes the problems.
People second guess this, which is the same for an Uptrend.