Atlassian fell almost 13% in two days, from 220.12 on Wednesday to 191.72 on Friday. That ended a run that had taken it from 56 in April to 229.96 on 22 October. Friday closed right on the 50 EMA and the 61.8% retracement of the October rally, so the next few sessions decide whether this is a pullback or a top.
Daily Chart
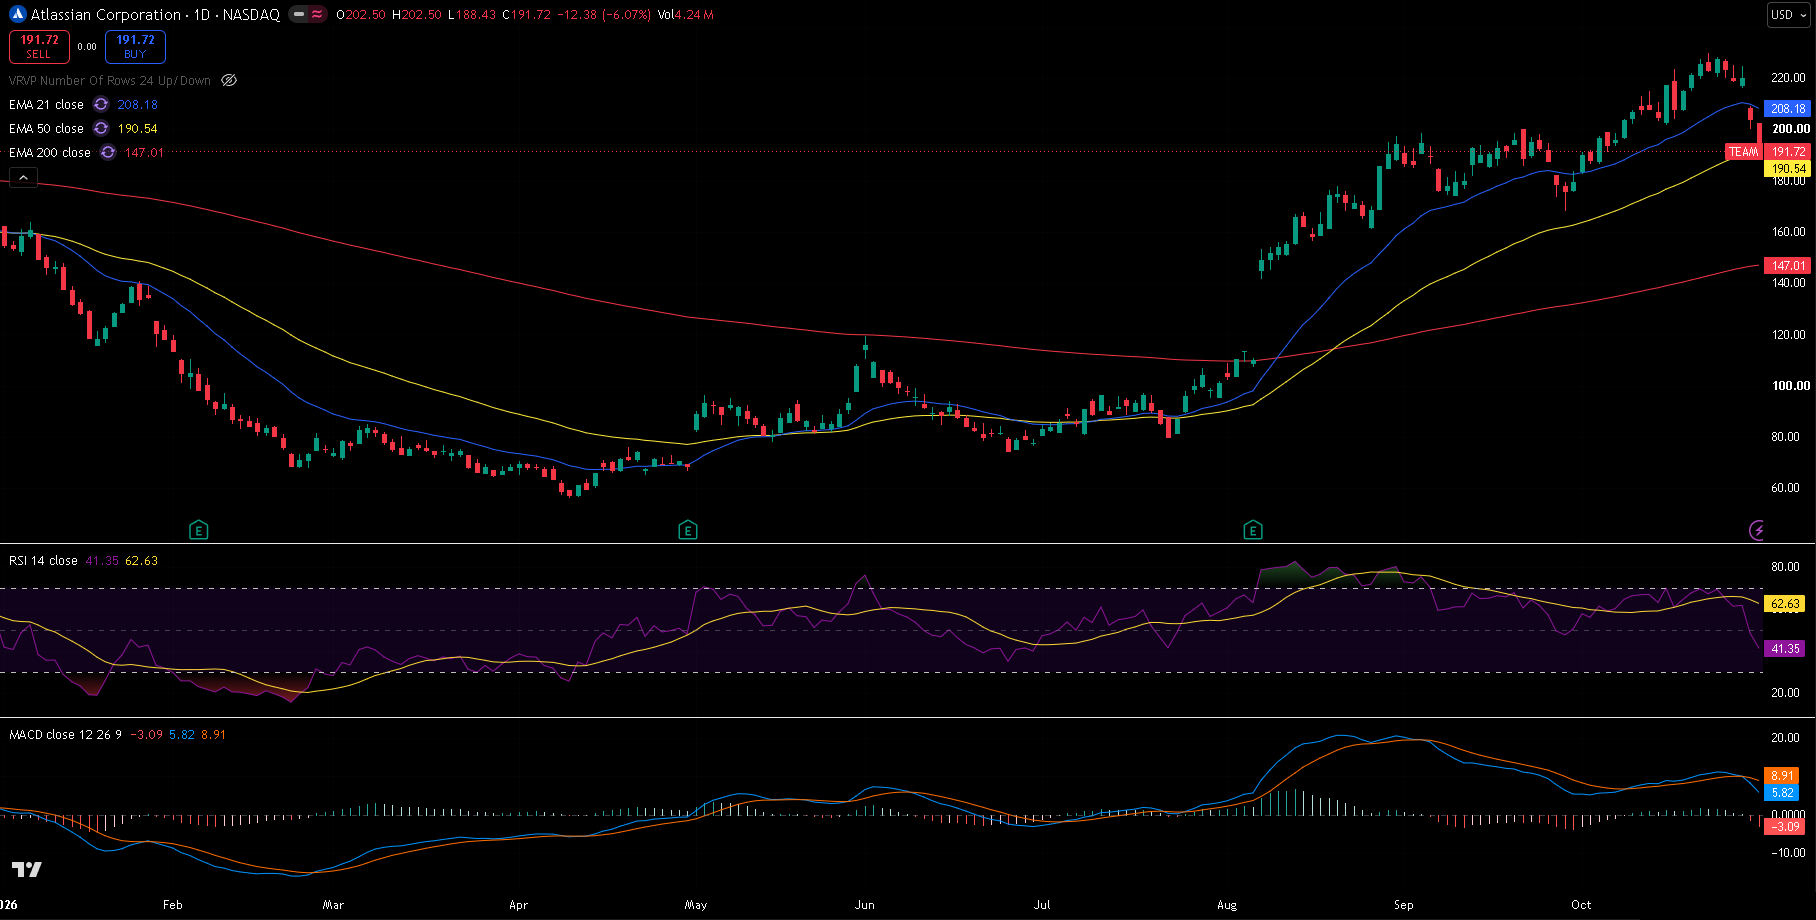
TEAM daily chart, 30 October 2026 close — 21/50/200 EMA, RSI(14) with its moving average, and MACD(12,26,9). The August gap launched the rally; Friday's close tested the 50 EMA for the first time since early October.
Trend and Structure
Atlassian is one of the strongest charts of 2026: from a 56.01 low on 10 April it climbed to 229.96 on 22 October, helped by a big gap higher in early August. The rally has held a pattern of higher lows — 160.96 on 26 August, 168.05 on 29 September — and the EMAs are stacked bullishly, 21 (208.18) above 50 (190.54) above 200 (147.01). The last two sessions broke the short-term picture, though: price dropped through the 21 EMA and Friday's low at 188.43 dipped below the 50 EMA before closing just above it.
Key Levels
The level that matters most is 188–192: the 50 EMA (190.54), the 61.8% retracement (191.70) and Friday's low (188.43). Overhead, the 21 EMA at 208.18 is the line buyers need back.
| Type | Level | Why it matters |
|---|---|---|
| Resistance | 229.96 | 22 October high, the 2026 high |
| EMA 21 | 208.18 | Short-term trend, lost on Thursday |
| Fib 38.2% | 206.31 | First retracement of the October rally |
| Resistance | 200.00 | 22 September high; with the 50% level at 199.01 |
| Fib 61.8% | 191.70 | Friday closed right on it |
| Current | 191.72 | Last close |
| EMA 50 | 190.54 | Medium-term trend, tested on Friday |
| Support | 188.43 | Friday's low |
| Support | 182.57 | 1 October low |
| Fib 78.6% | 181.30 | Deepest retracement before the October rally is undone |
| Support | 168.05 | 29 September low, the last higher low |
| EMA 200 | 147.01 | Long-term trend |
Fibonacci levels are drawn from the 29 September low at 168.05 to the 22 October high at 229.96.
Momentum and Volume
RSI(14) has dropped to 41.35, well below its own average of 62.63 — a sharp loss of momentum. MACD is at 5.82 against a signal line of 8.91, a histogram of -3.09: still above zero, but crossed down. Volume rose on the selling, with 4.1 million shares on Thursday and 4.2 million on Friday against a 20-day average of about 2.5 million.
Bull Case
The 188–192 band holds, keeping the pattern of higher lows intact. A daily close back above the 21 EMA at 208.18 would turn this into a normal pullback and put the 229.96 high back in play.
Bear Case
A daily close below the 1 October low at 182.57 would break the 50 EMA and the 78.6% level, and signal that the October rally has failed. That opens the 29 September low at 168.05, with the 200 EMA at 147.01 the next major level.
Trade Scenarios
| Direction | Trigger | Stop | Target |
|---|---|---|---|
| Long | Daily close above 208.18 | 188.00 | 229.96 |
| Short | Daily close below 182.57 | 200.00 | 168.05, then 147.01 |
Risk warning: Technical analysis reflects probability, not certainty. Levels are reference points, not signals. Capital at risk. This is educational content, not investment advice.