Palantir doubled from its June low of 106.10 to a 2026 high of 212.94 on 12 October, but Friday's 6.3% drop to 184.11 broke the first Fibonacci level of that rally and closed just under the 50 EMA. The 38.2% retracement at 172.24 is the next support; the rising trendline from June sits lower, near 153.
Daily Chart
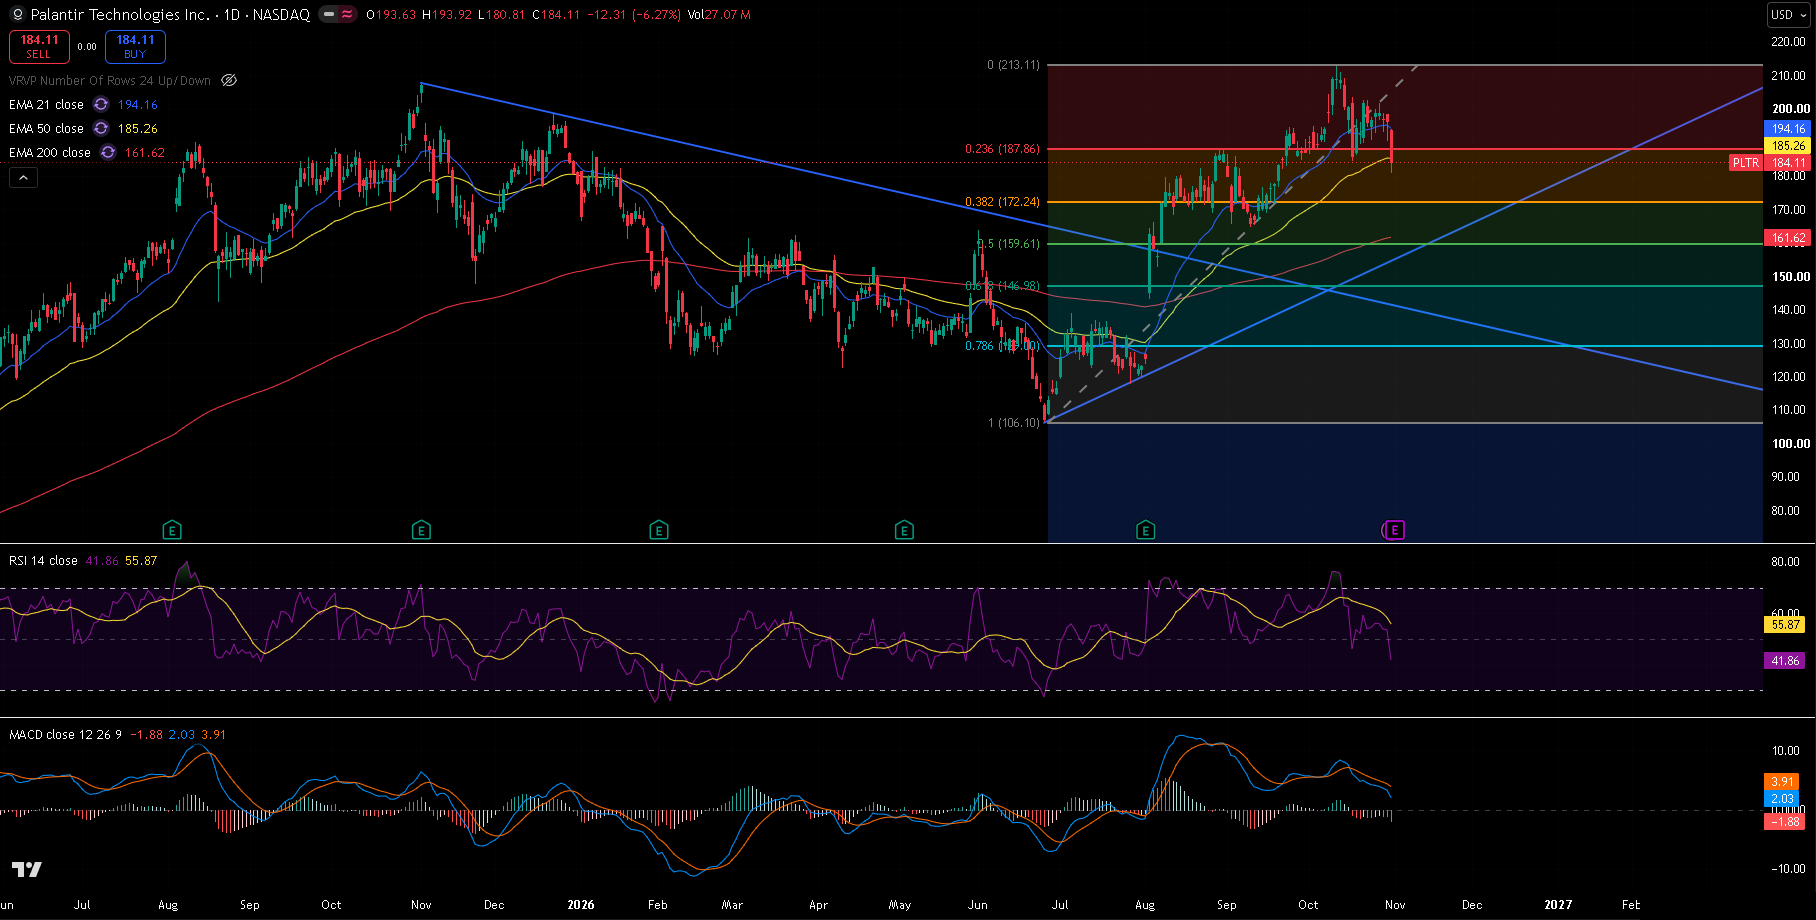
PLTR daily chart, 30 October 2026 close — 21/50/200 EMA, RSI(14) with its moving average, MACD(12,26,9), the Fibonacci retracement of the June–October rally, the rising trendline from the June low and the falling trendline from the November 2025 high. Friday closed below the 23.6% level.
Trend and Structure
Palantir's summer rally started at 106.10 on 25 June, broke the falling trendline from the November 2025 high in August, and ran to 212.94 on 12 October. Since then the stock has held a range between about 184 and 203, with the 16 October low at 184.45 the floor. Friday broke it, closing at 184.11 after a low of 180.81. Price is now below the 21 EMA (194.16) and just under the 50 EMA (185.26), but well above the 200 EMA (161.62) and the rising trendline from June.
Key Levels
The level that matters most is 184–188: the 23.6% retracement (187.86), the 50 EMA (185.26) and the broken 16 October low (184.45). Below, the 38.2% level at 172.24 is the next real support.
| Type | Level | Why it matters |
|---|---|---|
| Resistance | 212.94 | 12 October high, the 2026 high |
| Resistance | 202.63 | 22 October high, top of the recent range |
| EMA 21 | 194.16 | Short-term trend |
| Fib 23.6% | 187.86 | Broken on Friday |
| EMA 50 | 185.26 | Medium-term trend, closed just below |
| Resistance | 184.45 | 16 October low, the old range floor |
| Current | 184.11 | Last close |
| Support | 180.81 | Friday's low |
| Fib 38.2% | 172.24 | First major retracement of the June–October rally |
| Support | 164.55 | 10 September low |
| EMA 200 | 161.62 | Long-term trend; with the 50% level at 159.61 |
| Trendline | ~153 | Rising trendline from the June low |
Fibonacci levels are drawn from the 25 June low at 106.10 to the October high near 213.11. The trendline level is approximate and read from the chart.
Momentum and Volume
RSI(14) has dropped to 41.86, well below its own average of 55.87. MACD is at 2.03 against a signal line of 3.91, a histogram of -1.88: still above zero, but falling. Friday's 27.1 million shares was about 1.2 times the 20-day average of 23.1 million.
Bull Case
Friday's low at 180.81 holds and price closes back above the 21 EMA at 194.16, back inside the October range. That would put the 22 October high at 202.63 and the 212.94 peak back in play.
Bear Case
A daily close below 180.81 confirms the range break and opens the 38.2% level at 172.24. Below that, the 200 EMA and 50% level around 160 and the rising trendline near 153 are the key supports for the summer uptrend.
Trade Scenarios
| Direction | Trigger | Stop | Target |
|---|---|---|---|
| Long | Daily close above 194.16 | 180.00 | 202.63, then 212.94 |
| Short | Daily close below 180.81 | 192.00 | 172.24, then 161.62 |
Risk warning: Technical analysis reflects probability, not certainty. Levels are reference points, not signals. Capital at risk. This is educational content, not investment advice.