NVIDIA closed Friday at 208.27 (+4.32%) on 214m shares — 41.8% above the 20-day average — printing a high of 210.95 that retests the November 2025 all-time-high zone almost to the cent. Pre-market is bid 208.72. The whole tape now hinges on one number: the 211 prior peak. A daily close above it confirms a new ATH and opens the 1.272 extension at 224.85. Failure here, with RSI already at 71.5, is a textbook double-top risk.
Daily Chart
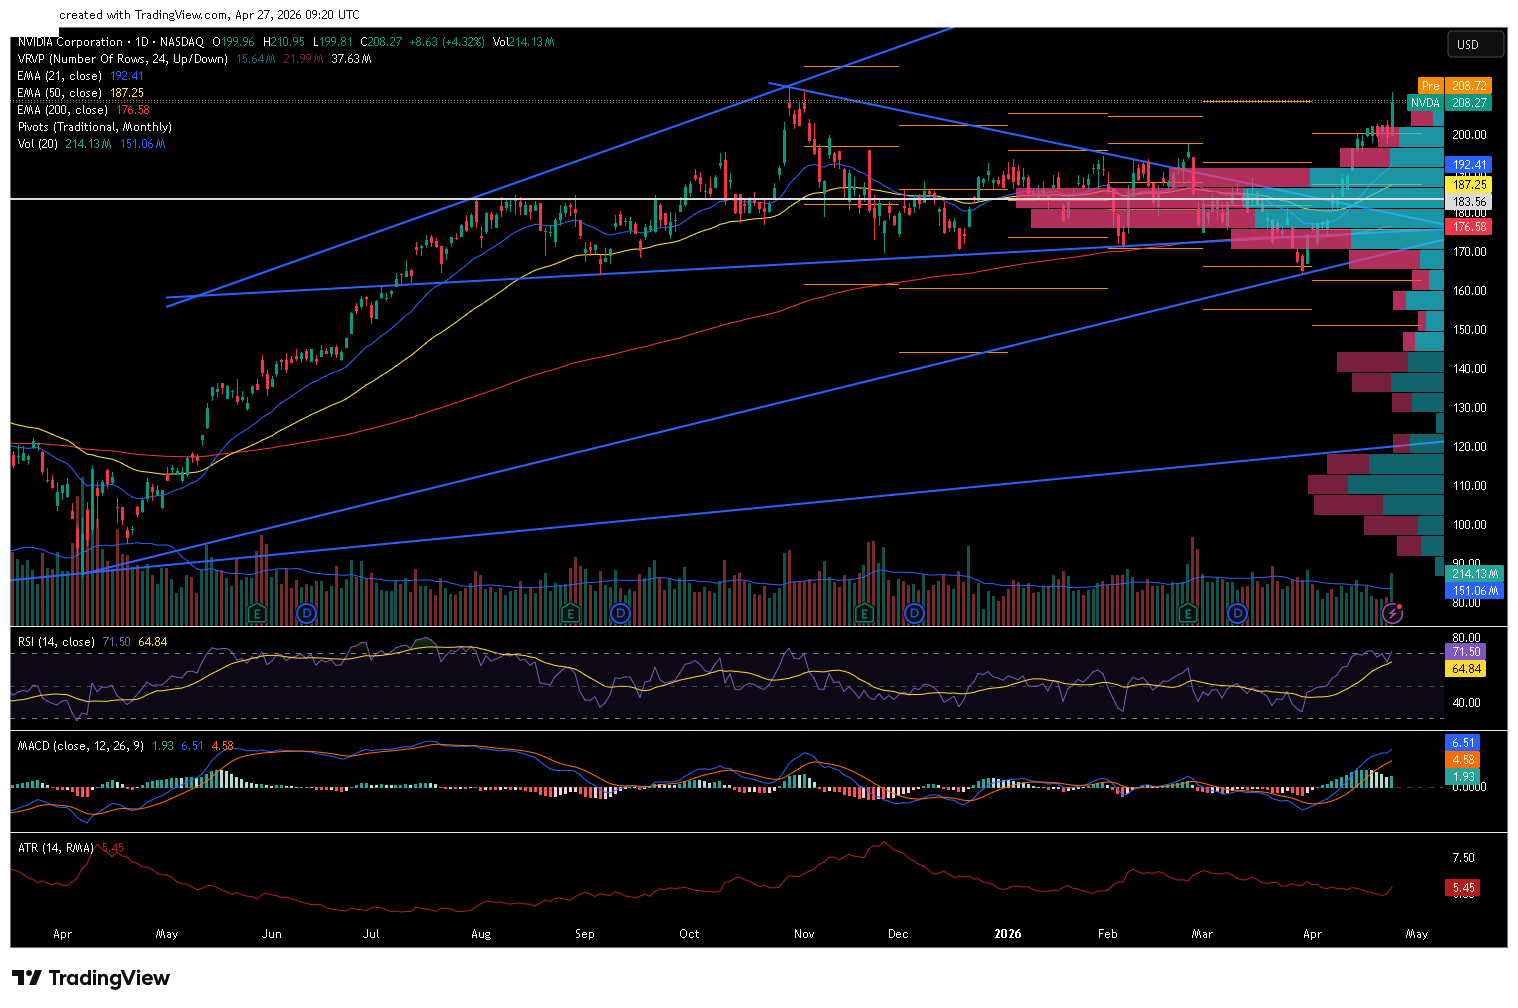
NVDA daily chart, 27 April 2026 — 21/50/200 EMA, RSI(14) with signal MA, MACD(12,26,9), ATR(14), Volume with 20-day MA, Monthly Pivot Points (Traditional), long-term ascending trendlines from the April 2025 lows, and Visible Range Volume Profile. Friday's high at 210.95 lands precisely at the November 2025 swing-high zone — a clean retest from below.
Trend and Structure
The dominant trend is up. From the April 2025 low near 80, NVDA built a clean staircase of higher highs and higher lows into the November 2025 peak at 211, then corrected hard into the April 2026 low near 160 — about 24% top-to-bottom. The recovery from that low has been linear and aggressive: from 160 to 210 in roughly three weeks, taking back every retracement and breaking the descending trendline that had capped price since November. The three EMAs are now stacked in textbook bullish order — price 208.27 > EMA 21 192.41 > EMA 50 187.25 > EMA 200 176.58 — and the long-term ascending trendline anchored to the early-2025 low currently sits in the 170s, well below price. That is a healthy structure. The single open question is whether the ATH retest at 211 holds as resistance or breaks for fresh highs.
Key Levels
The level that decides the next leg is 211. Anchoring fibs to the April 2026 swing low at 160 and the current high at 211 puts the 0.382 retracement at 191.51 — within a dollar of the EMA 21 at 192.41, the cleanest support confluence on the chart.
| Type | Level | Why it matters |
|---|---|---|
| Fib 1.618 ext | 242.52 | Measured-move target if 211 breaks and 225 falls |
| Fib 1.272 ext | 224.85 | First extension target on a confirmed ATH break |
| Resistance | 210.95 | Friday's high — the retest of the November 2025 peak zone |
| Pre-market | 208.72 | Monday indication, sitting just below resistance |
| Current | 208.27 | Last close |
| Round-number | 200.00 | Reclaimed support; first line of defence on any pullback |
| EMA 21 / Fib 0.382 | 192.41 | Cleanest confluence on the chart — EMA 21 at 192.41, fib 0.382 at 191.51 |
| EMA 50 | 187.25 | Mid-trend support, sits just above the monthly pivot |
| Monthly Pivot (P) | 183.56 | April Traditional pivot — held as support twice this month |
| EMA 200 / Volume POC | 176.58 | Long-term trend line; volume profile POC sits in the 178-185 high-volume node just above |
| Structural support | 160.00 | April 2026 swing low — full invalidation of the recovery |
The fib framework anchored low-to-high on the April rally puts every meaningful retracement on top of an EMA: 0.382 with EMA 21, 0.5 (185.50) with EMA 50, 0.618 (179.48) just above EMA 200. Stacked support at three layers, which is what a healthy uptrend looks like on a pullback.
Momentum and Volume
RSI(14) closed at 71.50, above its signal MA at 64.84 and into the slightly overbought zone — momentum is strong but the indicator is now extended for the first time since November. MACD(12,26,9) is firmly bullish: the MACD line at 6.51 sits well above signal at 4.58, both above the zero line, and the histogram at +1.93 is still expanding. ATR(14) is 5.45, about 2.6% of price — enough room to size a stop sensibly without cropping a normal day's range. Friday's 214.13m shares ran 41.8% above the 20-day MA of 151.06m on a +4.32% session that closed in the upper third of its range. That is accumulation, not blow-off — but a second 4% day on similar volume into 215 would be the classic exhaustion footprint to watch for.
Bull Case
A daily close above 211 confirms the November high is broken and turns this whole consolidation into a base for the next leg. The first measured target sits at 224.85 (1.272 extension of the April rally), with 242.52 (1.618) as the stretch objective if momentum carries. With RSI at 71 a brief consolidation or shallow pullback to 200-202 before the breakout is the higher-probability path; that gives a cleaner long entry than chasing the close.
Bear Case
A failure at 211 with a daily close back below 200 sets up a double-top against the November peak and opens a slide back into the EMA 21 at 192.41 — which is also the 0.382 fib of the recovery. Lose 192 with conviction and the EMA 50 / monthly pivot zone at 183-187 is the next magnet. RSI at 71.5 with price into prior resistance is the classic divergence setup; a lower RSI high on a marginal new price high would tilt the odds.
Trade Scenarios
| Direction | Trigger | Stop | Target |
|---|---|---|---|
| Long | Daily close above 211.00 | 199.50 (below round-number support, ~2.1x ATR) | 224.85 |
| Short | Daily close below 200.00 | 208.50 (above prior close, ~1.6x ATR) | 192.41 |
Risk warning: Technical analysis reflects probability, not certainty. Levels are reference points, not signals. Capital at risk. This is educational content, not investment advice.