Netflix closed Friday at 62.08, down more than half from its mid-2025 high of about 134, and is now sitting on the 61.8% retracement of its whole 2022–2025 rally at 61.61. The stock has lost its long rising trendline from 2022 and is below all three EMAs. This is a major support test; RSI near 30 shows how stretched the selling is.
Daily Chart
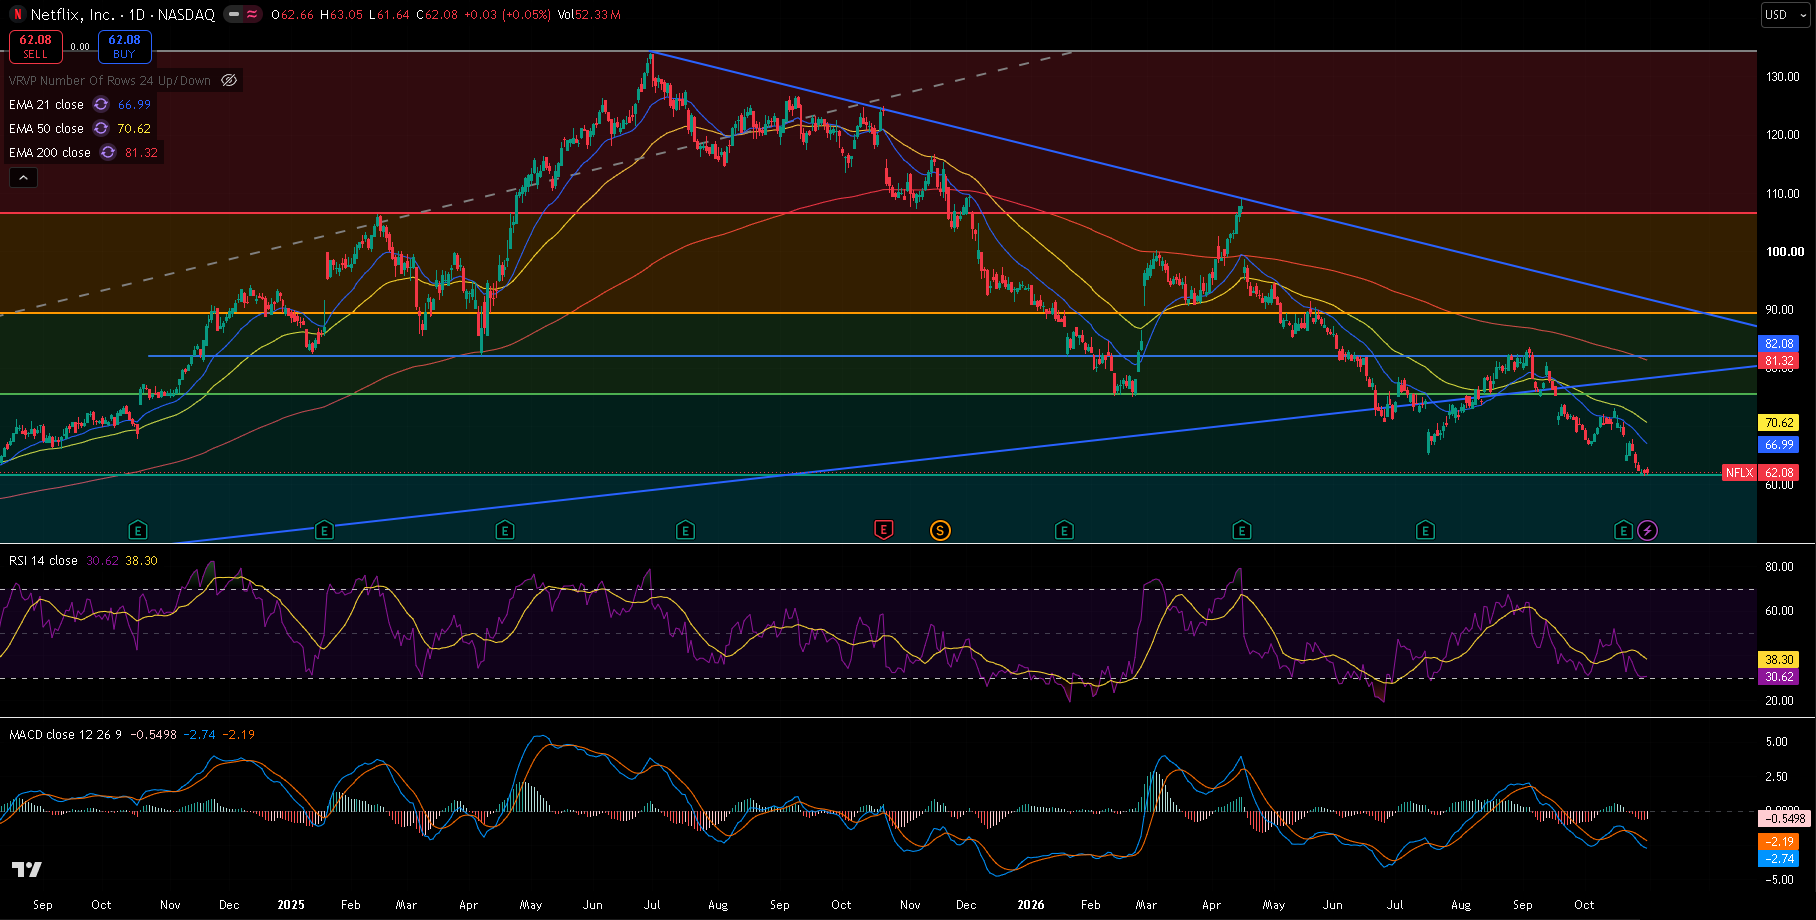
NFLX daily chart since September 2024, 30 October 2026 close — 21/50/200 EMA, RSI(14) with its moving average, MACD(12,26,9), the Fibonacci retracement of the 2022–2025 rally, the 82.08 level, the rising trendline from 2022 and the falling trendline from the 2025 high. Price is resting on the 61.8% level.
Trend and Structure
Netflix peaked near 134 in mid-2025 and has made lower highs under a falling trendline ever since — that line is now around 88. The long rising trendline from the 2022 low gave way in the summer, was fought over in August and early September, and has been firmly broken since mid-September; the 21 October gap from 68.69 to 64.10 on 101 million shares added to the damage. Price has drifted lower since, to 61.39 on Wednesday. The EMAs are stacked bearishly — 21 (66.99) under 50 (70.62) under 200 (81.32) — and price is below all three.
Key Levels
The level that matters most is 61.4–61.6: the 61.8% retracement of the 2022–2025 rally and Wednesday's low. Overhead, the 21 EMA at 66.99 is the first test, with the broken trendline and the 200 EMA near 79–82 far above.
| Type | Level | Why it matters |
|---|---|---|
| Fib 38.2% | 89.43 | Retracement of the 2022–2025 rally |
| Trendline | ~88 | Falling trendline from the 2025 high |
| Resistance | 82.08 | Horizontal level on the chart |
| EMA 200 | 81.32 | Long-term trend |
| Trendline | ~79 | Rising trendline from 2022, broken since mid-September |
| Fib 50% | 75.52 | Half-way back on the 2022–2025 rally |
| Resistance | 73.07 | 15 October high |
| EMA 50 | 70.62 | Medium-term trend |
| EMA 21 | 66.99 | Short-term trend |
| Current | 62.08 | Last close |
| Fib 61.8% | 61.61 | Major long-term support, being tested now |
| Support | 61.39 | 29 October low |
| Fib 127.2% | 58.21 | Extension of the October fall if 61.4 gives way |
The long-term Fibonacci levels are drawn from the 2022 low near 16.60 to the 2025 high near 134.44. The 58.21 level extends the 15–29 October fall. Trendline levels are approximate and read from the chart.
Momentum and Volume
RSI(14) is at 30.62, right on the edge of oversold and below its own average of 38.30. MACD is at -2.74 against a signal line of -2.19, a histogram of -0.55, below zero and drifting lower. Volume has stayed above average through the slide: Friday traded 52.3 million shares against a 20-day average of about 44.8 million, and the 21 October gap came on 101 million.
Bull Case
The 61.8% level holds, as big retracement levels often do when RSI is this low, and price closes back above the 21 EMA at 66.99. That would open the 50 EMA at 70.62 and the 15 October high at 73.07.
Bear Case
A daily close below Wednesday's 61.39 low breaks the 61.8% level, a serious long-term warning. The 127.2% extension of the October fall at 58.21 is the first measured target, and below that the chart offers little until the 78.6% retracement in the low 40s.
Trade Scenarios
| Direction | Trigger | Stop | Target |
|---|---|---|---|
| Long | Daily close above 66.99 | 60.50 | 73.07, then ~79 |
| Short | Daily close below 61.39 | 66.00 | 58.21 |
Risk warning: Technical analysis reflects probability, not certainty. Levels are reference points, not signals. Capital at risk. This is educational content, not investment advice.