Micron gapped down 5.3% on Friday to 884.74, two days after last week's bounce stalled at 990.00 — short of 1000 and well below the September high of 1108.72. Price is under the 21 and 50 EMAs and sitting on the 61.8% retracement of the summer rally. The 849–862 lows are the next support.
Daily Chart
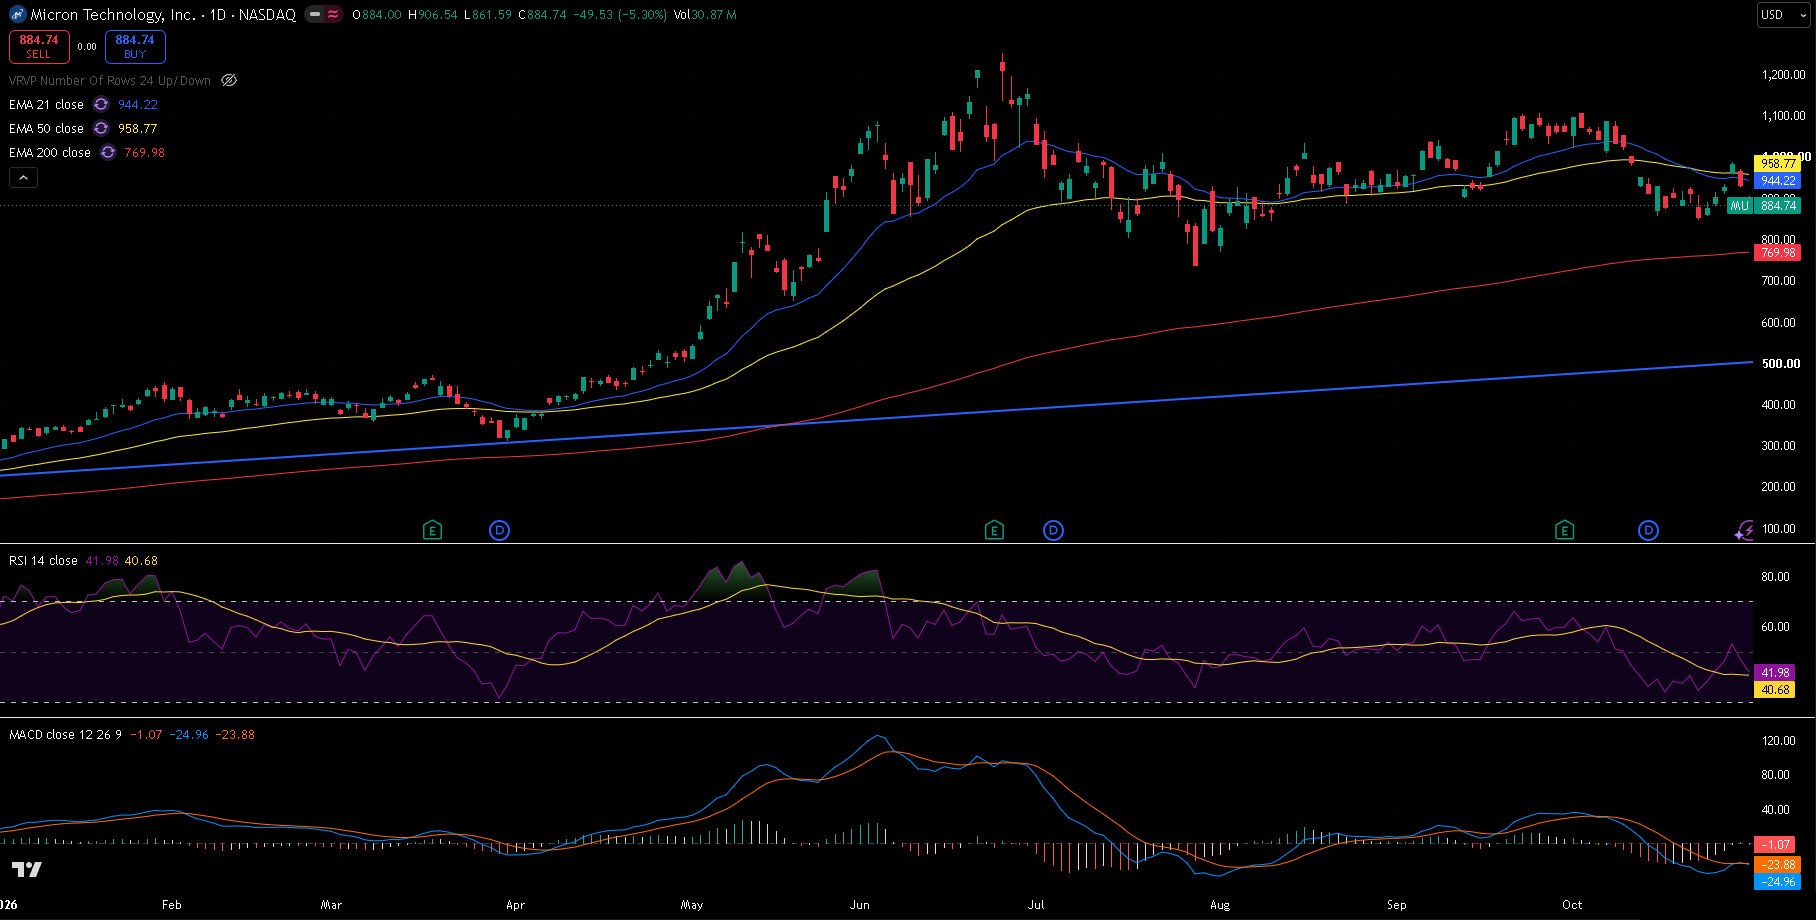
MU daily chart, 30 October 2026 close — 21/50/200 EMA, RSI(14) with its moving average, MACD(12,26,9), and the long rising trendline from the start of the year. Price is back below both short-term EMAs after a failed bounce.
Trend and Structure
Micron's 2026 run has been enormous, from under 300 in January to a peak of 1255 on 25 June. Since then the highs have stepped lower — 1108.72 on 25 September, 1108 on 2 October and 990.00 on 28 October — while the stock has swung in a wide range. The October low was 849.25 on 22 October. Price is now under the 21 EMA (944.22) and 50 EMA (958.77), with the 21 below the 50, but still far above the rising 200 EMA (769.98).
Key Levels
The level that matters most is 849–880: the 61.8% retracement (879.54), Friday's low (861.59) and the 22 October low (849.25). Overhead, the EMAs at 944–959 and last week's 990.00 high are the resistance.
| Type | Level | Why it matters |
|---|---|---|
| Resistance | 1108.72 | 25 September high |
| Resistance | 990.00 | 28 October high, the latest lower high |
| EMA 50 | 958.77 | Medium-term trend |
| EMA 21 | 944.22 | Short-term trend |
| Fib 50% | 923.30 | Half-way back on the July–September rally |
| Current | 884.74 | Last close |
| Fib 61.8% | 879.54 | Price is sitting just above it |
| Support | 861.59 | Friday's low |
| Support | 849.25 | 22 October low |
| Fib 78.6% | 817.24 | Deepest retracement before the rally is undone |
| EMA 200 | 769.98 | Long-term trend |
| Support | 737.88 | 29 July low, start of the rally |
Fibonacci levels are drawn from the 29 July low at 737.88 to the 25 September high at 1108.72.
Momentum and Volume
RSI(14) is at 41.98, just above its own average of 40.68 — weak but steady. MACD is at -24.96 against a signal line of -23.88, a histogram of -1.07: below zero and slipping again after last week's brief turn. Friday's 30.9 million shares was a little above the 20-day average of about 26.1 million.
Bull Case
The 849–880 band holds and price closes above last week's 990.00 high, clearing both EMAs. That would end the run of lower highs and open the September high at 1108.72.
Bear Case
A daily close below the 22 October low at 849.25 confirms another lower low. That opens the 78.6% level at 817.24, with the 200 EMA at 769.98 below.
Trade Scenarios
| Direction | Trigger | Stop | Target |
|---|---|---|---|
| Long | Daily close above 990.00 | 920.00 | 1108.72 |
| Short | Daily close below 849.25 | 935.00 | 817.24, then 769.98 |
Risk warning: Technical analysis reflects probability, not certainty. Levels are reference points, not signals. Capital at risk. This is educational content, not investment advice.