Microsoft is up almost 50% from its June low, but the rally has stalled. Thursday opened at 540.22 and closed at 530.14, and Friday slipped to 521.91, under the 21 EMA. The 509–515 area, where the 50 EMA and recent lows meet, is now the level the uptrend needs to hold.
Daily Chart
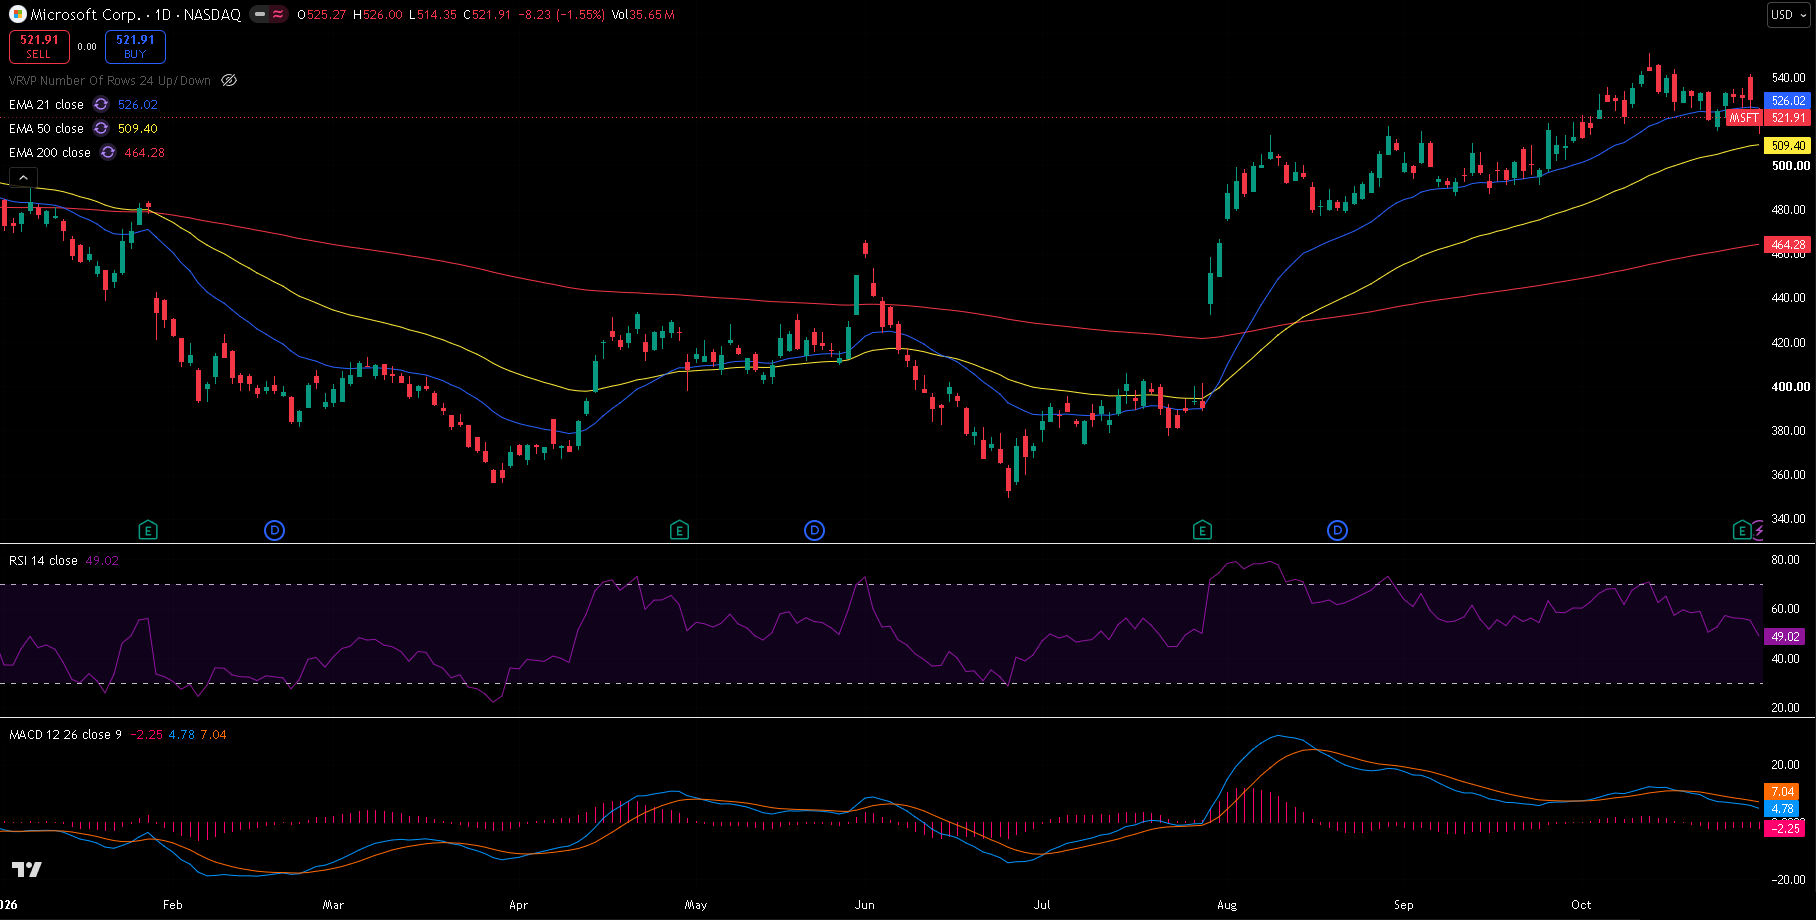
MSFT daily chart, 30 October 2026 close — 21/50/200 EMA, RSI(14) and MACD(12,26,9). The late-July gap still anchors the uptrend; Thursday's high-volume reversal from 541 marks the latest failure near the top.
Trend and Structure
The big move came in late July, when Microsoft jumped from below 400 to above 460 in two sessions and kept going to 551.15 on 13 October — up from a 349.20 low on 25 June. Since that peak the stock has drifted sideways and slightly lower between about 514 and 541, with Thursday's push to 541.29 sold back hard. Price has now slipped below the 21 EMA (526.02) but is still above the rising 50 EMA (509.40) and far above the 200 EMA (464.28). The trend is still up; what has changed is that buyers are no longer pushing it higher.
Key Levels
The level that matters most is the 509–515 band: the 50 EMA (509.40), the 23.6% retracement (510.14), the 1 October low (512.17) and Friday's low (514.35). Overhead, 541.29 is the ceiling.
| Type | Level | Why it matters |
|---|---|---|
| Fib 127.2% | 598.42 | Extension of the July–October rally |
| Resistance | 551.15 | 13 October high, the 2026 high |
| Resistance | 541.29 | Thursday's high, sold back the same day |
| Resistance | 535.57 | 19 October high, top of last week's range |
| EMA 21 | 526.02 | Short-term trend, lost on Friday |
| Current | 521.91 | Last close |
| Support | 514.35 | Friday's low |
| Support | 512.17 | 1 October low |
| Fib 23.6% | 510.14 | First retracement of the July–October rally |
| EMA 50 | 509.40 | Medium-term trend, still rising |
| Support | 486.00 | 10 September low |
| Fib 38.2% | 484.77 | Lines up with the September low |
| EMA 200 | 464.28 | Long-term trend; with the 50% level at 464.27 |
Fibonacci levels are drawn from the 23 July low at 377.39 to the 13 October high at 551.15.
Momentum and Volume
RSI(14) is at 49.02, right on the midpoint — momentum has gone neutral after spending most of August to mid-October above 55. MACD is at 4.78 against a signal line of 7.04, a histogram of -2.25: still above zero, but the lines have crossed down and are drifting lower. Volume picked up on the selling: 39.3 million shares on Thursday and 35.7 million on Friday, against a 20-day average of about 22 million.
Bull Case
The 509–515 band holds and price closes back above Thursday's 541.29 high. That would end the pause and put the 13 October high at 551.15 back in play, with the 127.2% extension at 598.42 the next measured target.
Bear Case
A daily close below the 50 EMA at 509.40 would break the support band and turn the pause into a pullback. The 10 September low and 38.2% level at 484.77–486.00 come next, with the 200 EMA and 50% retracement at 464 below that.
Trade Scenarios
| Direction | Trigger | Stop | Target |
|---|---|---|---|
| Long | Daily close above 541.29 | 518.00 | 551.15, then 598.42 |
| Short | Daily close below 509.40 | 530.00 | 486.00, then 464.28 |
Risk warning: Technical analysis reflects probability, not certainty. Levels are reference points, not signals. Capital at risk. This is educational content, not investment advice.