Datadog gapped down and fell 11.5% on Friday, from 265.84 to 235.27, on twice its usual volume. That broke the 16 October low at 243.63 and put price below both the 21 and 50 EMAs. The 61.8% retracement at 240.46 is now overhead; the 200 EMA at 215 is the next big support.
Daily Chart
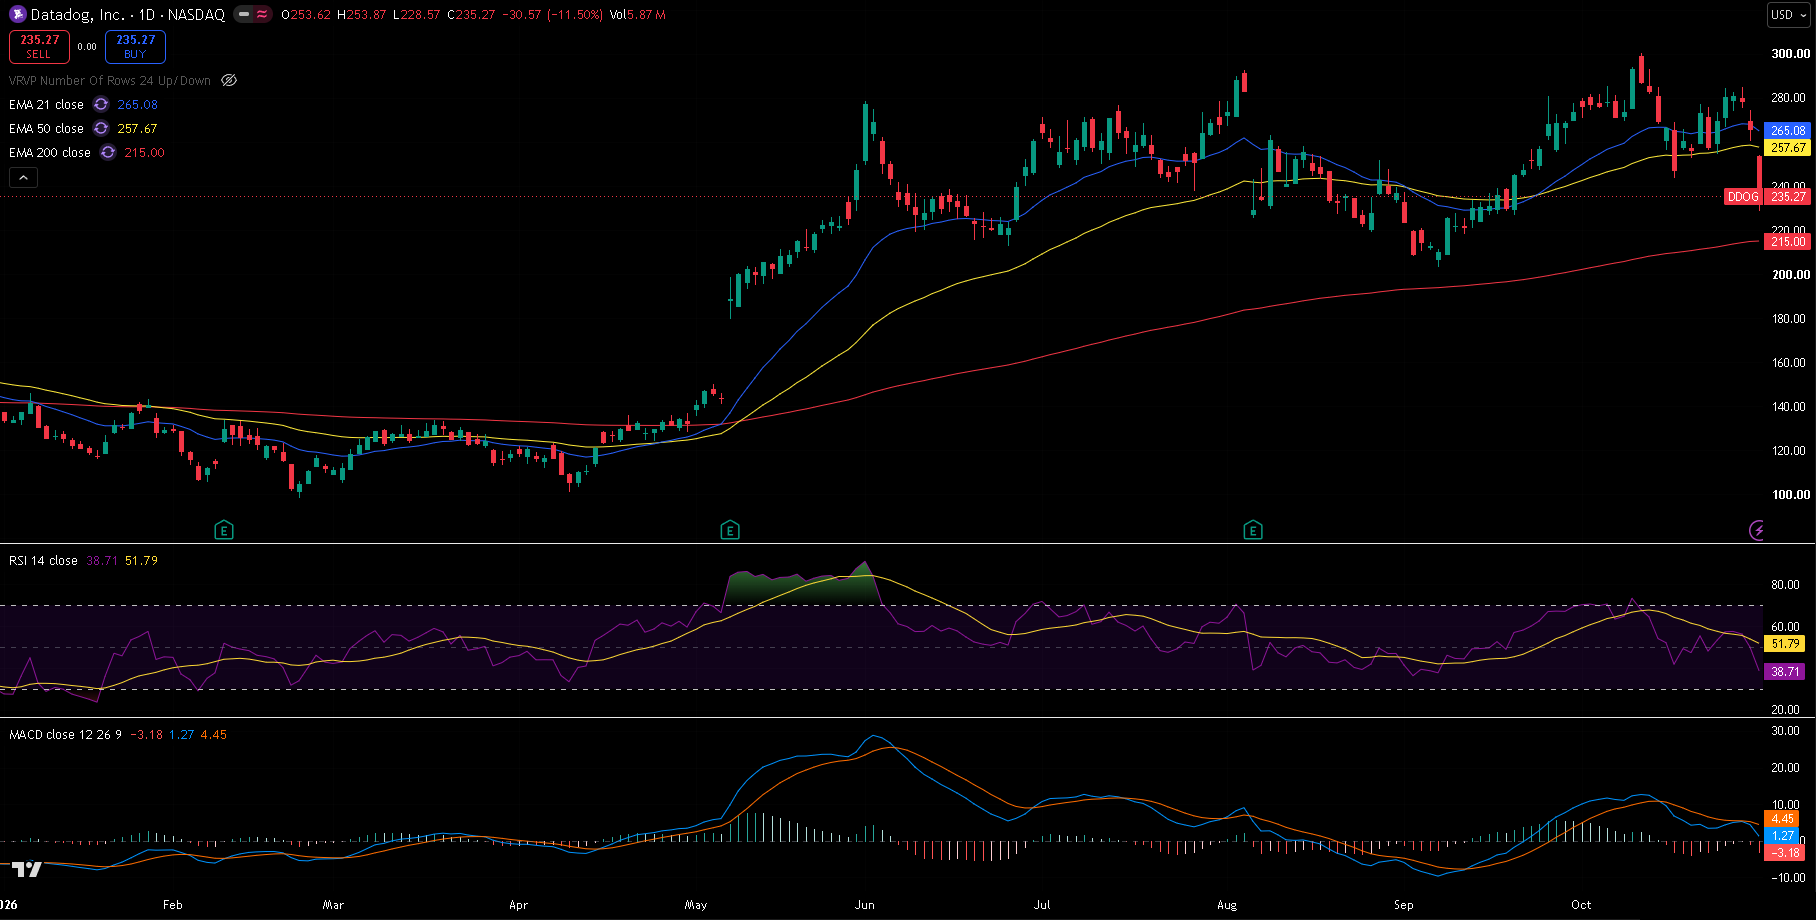
DDOG daily chart, 30 October 2026 close — 21/50/200 EMA, RSI(14) with its moving average, and MACD(12,26,9). Friday's gap dropped price below the October range and both short-term EMAs.
Trend and Structure
Datadog's 2026 move has been huge: from 98.01 in February to 300.68 on 12 October. The second half of the year has been choppier, with sharp swings between roughly 203 and 300. After the October high, the stock held 243.63 on 16 October and rebounded to 285.00 last week, but Friday opened at 253.62 and closed at 235.27, through that low. Price is now under the 21 EMA (265.08) and 50 EMA (257.67), though still well above the 200 EMA (215.00).
Key Levels
The level that matters most is 224–229: Friday's low (228.56) and the 78.6% retracement (224.09). Overhead, 240–244 — the 61.8% level and the broken 16 October low — is the first resistance.
| Type | Level | Why it matters |
|---|---|---|
| Resistance | 300.68 | 12 October high, the 2026 high |
| Resistance | 285.00 | 28 October high |
| EMA 21 | 265.08 | Short-term trend |
| EMA 50 | 257.67 | Medium-term trend |
| Resistance | 253.87 | Friday's high, top of the gap |
| Resistance | 243.63 | 16 October low, broken on Friday |
| Fib 61.8% | 240.46 | Retracement of the September–October rally |
| Current | 235.27 | Last close |
| Support | 228.56 | Friday's low |
| Fib 78.6% | 224.09 | Deepest retracement before the rally is undone |
| EMA 200 | 215.00 | Long-term trend |
| Support | 203.24 | 8 September low, start of the rally |
Fibonacci levels are drawn from the 8 September low at 203.24 to the 12 October high at 300.68.
Momentum and Volume
RSI(14) dropped to 38.71, well below its own average of 51.79. MACD is at 1.27 against a signal line of 4.45, a histogram of -3.18: still just above zero, but falling fast. Friday's 5.9 million shares was about twice the 20-day average of 2.9 million, the heaviest day since 2 September.
Bull Case
Friday's low at 228.56 holds and price recovers back above the gap and the 50 EMA at 257.67. That would make Friday a shake-out and put last week's 285.00 high back in reach, then 300.68.
Bear Case
A daily close below 228.56 opens the 78.6% level at 224.09 and the 200 EMA at 215.00. Below that, the 8 September low at 203.24 would mean the whole autumn rally has been given back.
Trade Scenarios
| Direction | Trigger | Stop | Target |
|---|---|---|---|
| Long | Daily close above 257.67 | 236.00 | 285.00, then 300.68 |
| Short | Daily close below 228.56 | 250.00 | 215.00, then 203.24 |
Risk warning: Technical analysis reflects probability, not certainty. Levels are reference points, not signals. Capital at risk. This is educational content, not investment advice.