Cisco fell 3.8% on Friday to 104.51 and touched 103.14, testing the floor of a range that has held since September. The highs keep getting lower — 124.71 in August, 118.65 and then 112.69 in October — while the lows sit flat around 103–104.5. The 200 EMA at 102.05 is just below; a close under it would break the pattern lower.
Daily Chart
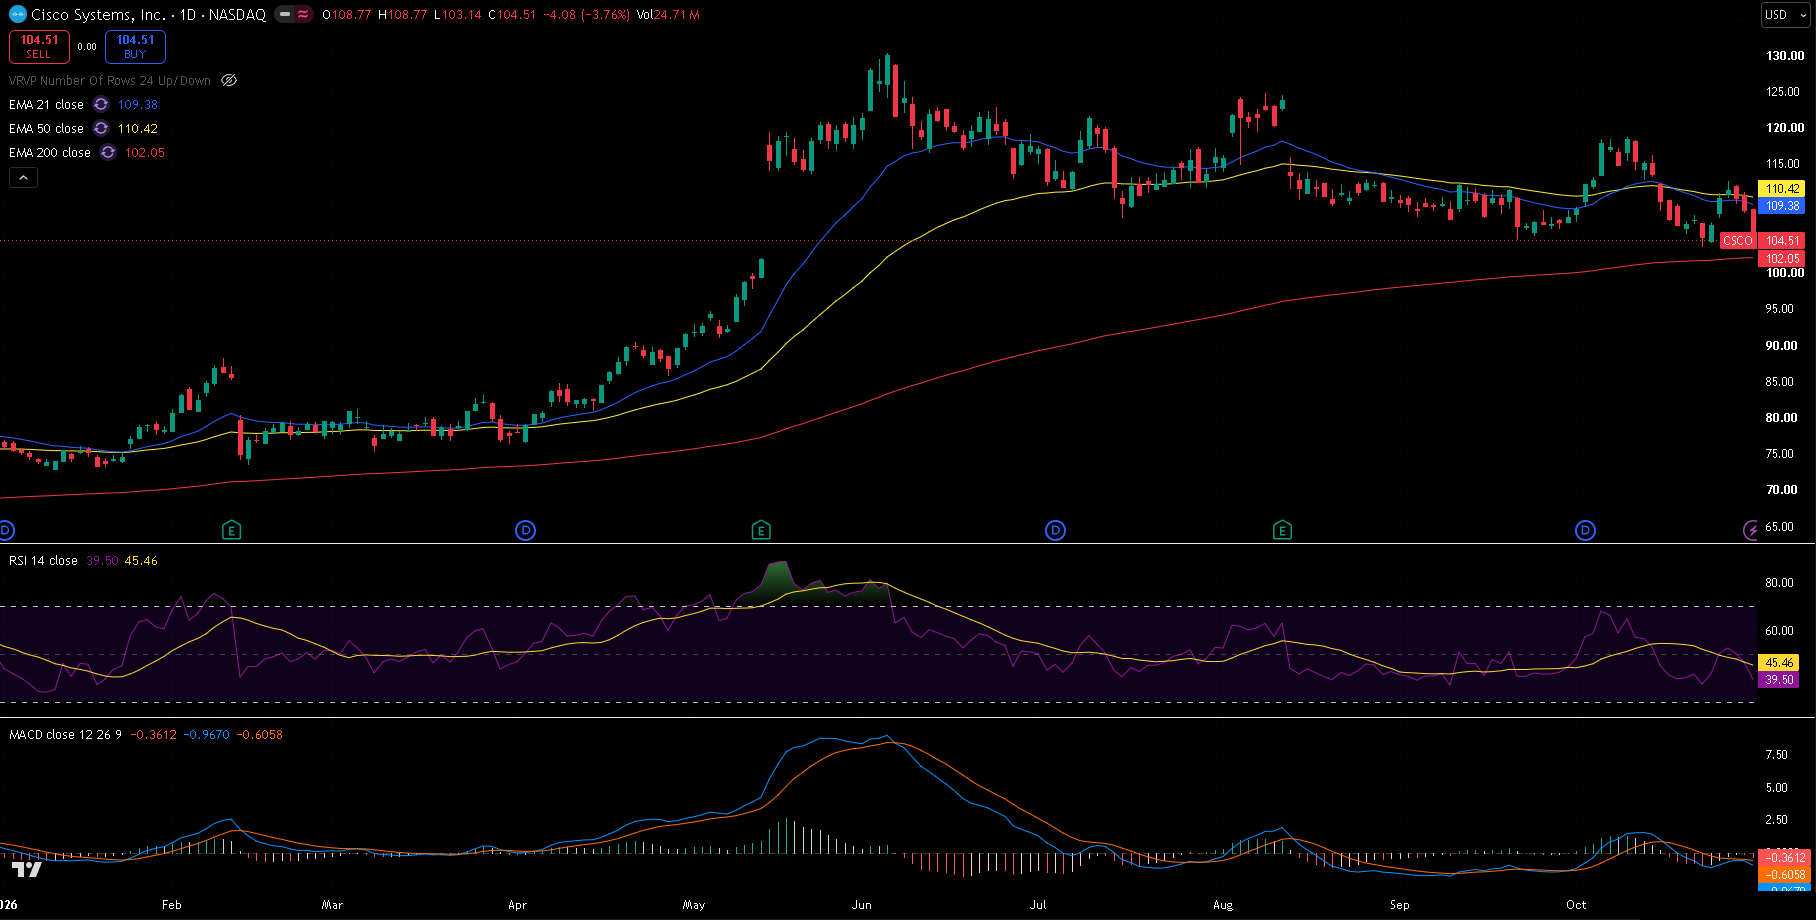
CSCO daily chart, 30 October 2026 close — 21/50/200 EMA, RSI(14) with its moving average, and MACD(12,26,9). Falling highs pressing down on a flat floor near 103–104.5, with the 200 EMA just underneath.
Trend and Structure
Cisco's spring rally took it from 76.54 in early April to 130.37 on 4 June. Since then the stock has drifted sideways and lower, with each high below the last and the lows holding at the same level: 104.51 on 22 September, 103.58 on 22 October and 103.14 on Friday. That shape — a flat floor under falling highs — often breaks downwards. Price is below the 21 EMA (109.38) and 50 EMA (110.42), with the 21 under the 50, but still just above the rising 200 EMA (102.05).
Key Levels
The level that matters most is 102–104.5: the range floor, the 50% retracement of the spring rally (103.46) and the 200 EMA (102.05). Overhead, last week's high at 112.69 is the top of the latest swing.
| Type | Level | Why it matters |
|---|---|---|
| Resistance | 124.71 | 10 August high |
| Resistance | 118.65 | 9 October high |
| Resistance | 112.69 | 27 October high, the latest lower high |
| EMA 50 | 110.42 | Medium-term trend |
| Fib 38.2% | 109.81 | With the 21 EMA |
| EMA 21 | 109.38 | Short-term trend |
| Current | 104.51 | Last close |
| Fib 50% | 103.46 | Half-way back on the spring rally; the range floor |
| Support | 103.14 | Friday's low, the lowest point of the range |
| EMA 200 | 102.05 | Long-term trend, still rising |
| Fib 61.8% | 97.10 | Deeper retracement of the spring rally |
| Support | 91.00 | 6 May low |
Fibonacci levels are drawn from the 2 April low at 76.54 to the 4 June high at 130.37.
Momentum and Volume
RSI(14) is at 39.50, below its own average of 45.46 and drifting lower. MACD is at -0.97 against a signal line of -0.61, a histogram of -0.36, just below zero. Friday's 24.7 million shares was about 1.6 times the 20-day average of 15.8 million. That is heavier than usual, though lighter than the 32.9 million traded on the 22 September test of the same floor.
Bull Case
The floor holds for a fourth time and price closes above last week's 112.69 high. That would break the run of lower highs and open the 9 October high at 118.65, then the August high at 124.71.
Bear Case
A daily close below the 200 EMA at 102.05 breaks both the range floor and the long-term trend line. The 61.8% retracement at 97.10 is the first target, with the 6 May low at 91.00 below.
Trade Scenarios
| Direction | Trigger | Stop | Target |
|---|---|---|---|
| Long | Daily close above 112.69 | 106.00 | 118.65, then 124.71 |
| Short | Daily close below 102.05 | 109.00 | 97.10, then 91.00 |
Risk warning: Technical analysis reflects probability, not certainty. Levels are reference points, not signals. Capital at risk. This is educational content, not investment advice.