CrowdStrike has more than tripled since February, peaking at 286.99 on 6 October. Last week's rebound stalled at 272.29, below that high, and Friday fell 4.1% to 250.43, just under the 21 EMA. The 240–246 area, where the 50 EMA and the 61.8% retracement meet, is the support that keeps the uptrend intact.
Daily Chart
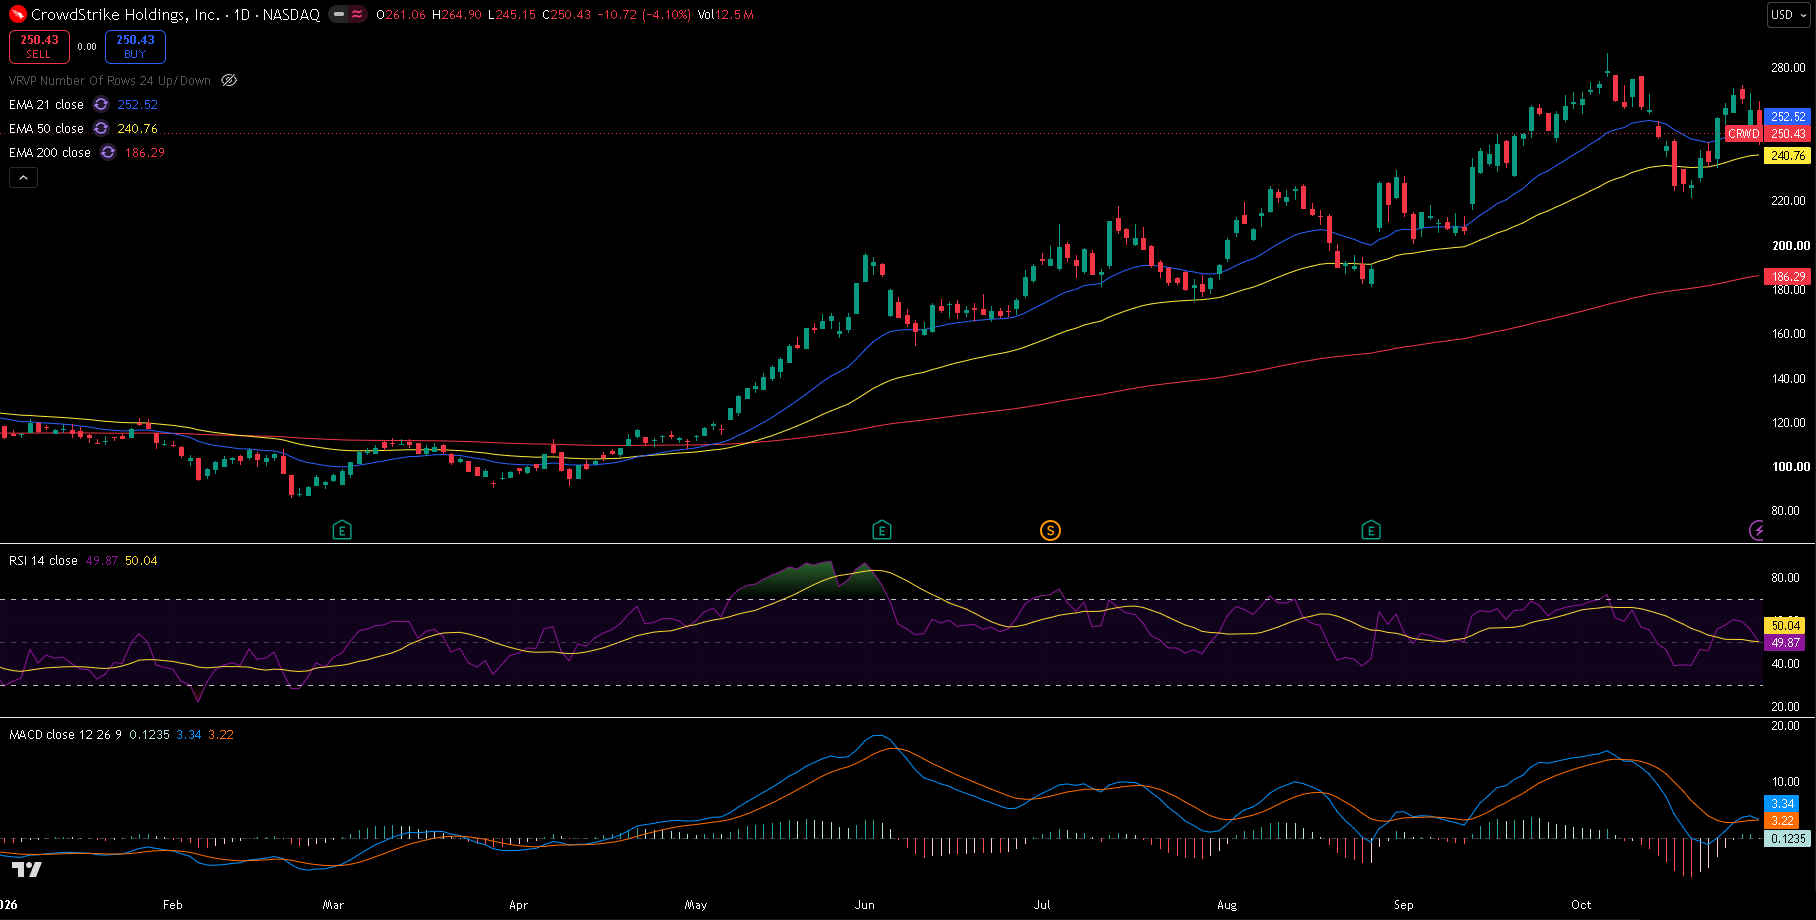
CRWD daily chart, 30 October 2026 close — 21/50/200 EMA, RSI(14) with its moving average, and MACD(12,26,9). A steep 2026 uptrend, now with a lower high at 272.29 below the October peak.
Trend and Structure
CrowdStrike climbed from 85.68 on 23 February to 286.99 on 6 October, with each pullback holding above the 50 EMA. The October dip reached 221.36 on 20 October, and the rebound to 272.29 on 28 October fell short of the peak — the first lower high since the spring. Friday's drop to 250.43 put price just below the 21 EMA (252.52) but still above the 50 EMA (240.76) and well above the 200 EMA (186.29). The trend is up; the question is whether this second pullback holds the 50 EMA as the others did.
Key Levels
The level that matters most is 240–246: the 50 EMA (240.76), the 61.8% retracement (240.82) and Friday's low (245.15). Overhead, last week's 272.29 high is the line for a new leg up.
| Type | Level | Why it matters |
|---|---|---|
| Resistance | 286.99 | 6 October high, the 2026 high |
| Resistance | 272.29 | 28 October high, a lower high |
| Resistance | 264.90 | Friday's high |
| EMA 21 | 252.52 | Short-term trend, lost on Friday |
| Current | 250.43 | Last close |
| Fib 50% | 246.83 | Half-way back on last week's rebound |
| Support | 245.15 | Friday's low |
| Fib 61.8% | 240.82 | With the 50 EMA at 240.76 |
| Support | 221.36 | 20 October low |
| Support | 200.60 | 2 September low |
| EMA 200 | 186.29 | Long-term trend |
Fibonacci levels are drawn from the 20 October low at 221.36 to the 28 October high at 272.29.
Momentum and Volume
RSI(14) is at 49.87, right on the midpoint and level with its own average of 50.04 — momentum is neutral. MACD is at 3.34 against a signal line of 3.22, a histogram of +0.12: above zero but flat. Friday's 12.5 million shares was about 1.4 times the 20-day average of 9.0 million.
Bull Case
The 50 EMA and 61.8% level hold around 240–246, and price closes above 272.29. That would remove the lower high and put the 286.99 peak back in play.
Bear Case
A daily close below the 50 EMA at 240.76 would break the support that has held all year. That opens the 20 October low at 221.36, then the 2 September low at 200.60.
Trade Scenarios
| Direction | Trigger | Stop | Target |
|---|---|---|---|
| Long | Daily close above 272.29 | 248.00 | 286.99 |
| Short | Daily close below 240.76 | 262.00 | 221.36, then 200.60 |
Risk warning: Technical analysis reflects probability, not certainty. Levels are reference points, not signals. Capital at risk. This is educational content, not investment advice.