Coherent fell 11.3% on Friday to 210.32, and the low at 203.87 retested the 23 October low of 203.55 almost to the cent. The stock is less than half its June high of 440 and well under all three EMAs. The 203–204 double floor is the line; below it the February low at 175.24 is the next support.
Daily Chart
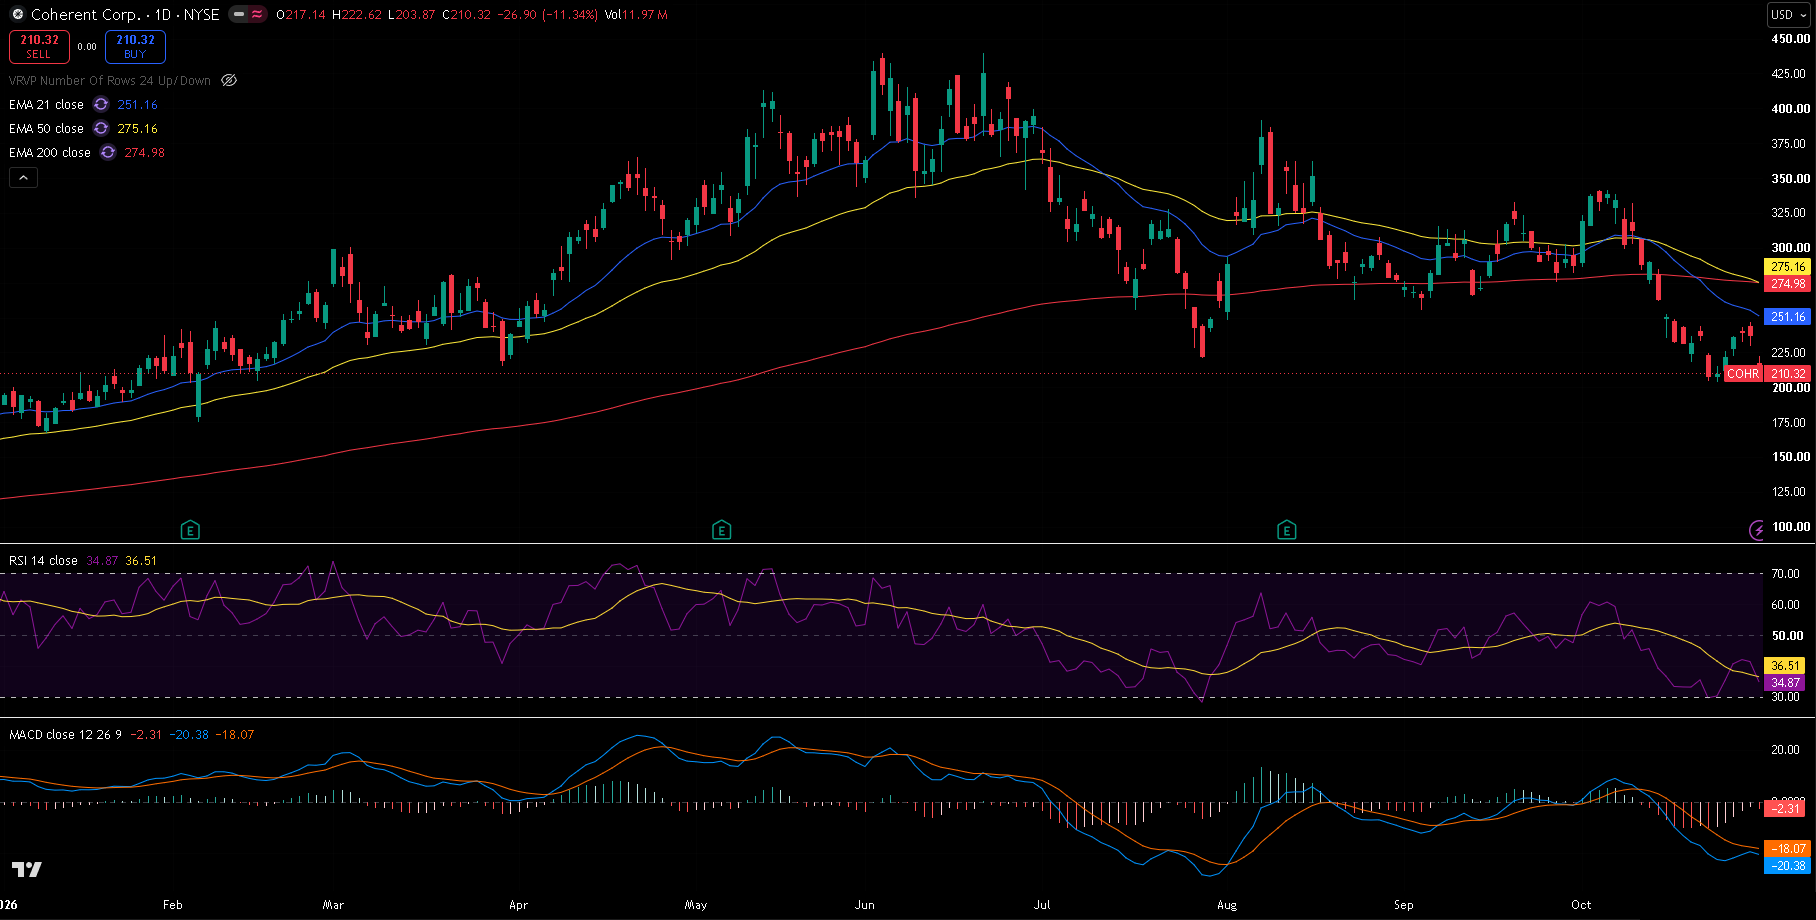
COHR daily chart, 30 October 2026 close — 21/50/200 EMA, RSI(14) with its moving average, and MACD(12,26,9). Friday's drop wiped out last week's bounce and returned price to the October low.
Trend and Structure
Coherent peaked at 440 on 3 June and has made lower highs since: 391.37 on 7 August and 341.76 on 5 October. The October slide took it to 203.55 on 23 October, a bounce reached 246.90 on Thursday, and Friday gave almost all of that back in one session. Price is far below the 21 EMA (251.16) and the 50 and 200 EMAs (275.16 and 274.98), which have flattened together. Swings of 5–12% a day have been common this month.
Key Levels
The level that matters most is 203–204: the 23 October low (203.55) and Friday's low (203.87). Overhead, Thursday's 246.90 high and the 21 EMA at 251.16 cap any bounce.
| Type | Level | Why it matters |
|---|---|---|
| Resistance | 341.76 | 5 October high |
| Resistance | 307.49 | 27 August high |
| EMA 50 | 275.16 | Medium-term trend; with the 200 EMA at 274.98 |
| Fib 50% | 272.66 | Half-way back on the October fall |
| Fib 38.2% | 256.35 | First meaningful retracement |
| EMA 21 | 251.16 | Short-term trend |
| Resistance | 246.90 | 29 October high, top of last week's bounce |
| Fib 23.6% | 236.17 | Where last week's bounce stalled |
| Current | 210.32 | Last close |
| Support | 203.87 | Friday's low |
| Support | 203.55 | 23 October low |
| Support | 175.24 | 5 February low |
Fibonacci levels are drawn from the 5 October high at 341.76 to the 23 October low at 203.55.
Momentum and Volume
RSI(14) is at 34.87, just below its own average of 36.51 and close to oversold. MACD is at -20.38 against a signal line of -18.07, a histogram of -2.31, deep below zero. Friday's 12.0 million shares was about 1.6 times the 20-day average of 7.5 million, similar to the 12.5 million on the 22 October drop.
Bull Case
The 203–204 double floor holds and price closes above Thursday's 246.90 high, back over the 23.6% level. That would open the 21 EMA and the 38.2% level at 251–256, then the flat 50 and 200 EMAs near 275.
Bear Case
A daily close below 203.55 breaks the double floor. With little on the chart in between, the 5 February low at 175.24 is the next support.
Trade Scenarios
| Direction | Trigger | Stop | Target |
|---|---|---|---|
| Long | Daily close above 246.90 | 220.00 | 275.16, then 307.49 |
| Short | Daily close below 203.55 | 225.00 | 175.24 |
Risk warning: Technical analysis reflects probability, not certainty. Levels are reference points, not signals. Capital at risk. This is educational content, not investment advice.