Ciena dropped 8.2% on Friday to 320.72, back down to the 311–314 floor that has held since September. The stock is half its June peak of 637.51 and has swung hard in both directions this month. Price is under all three EMAs; a close below 311.60 would break the floor and open the March lows near 278.
Daily Chart
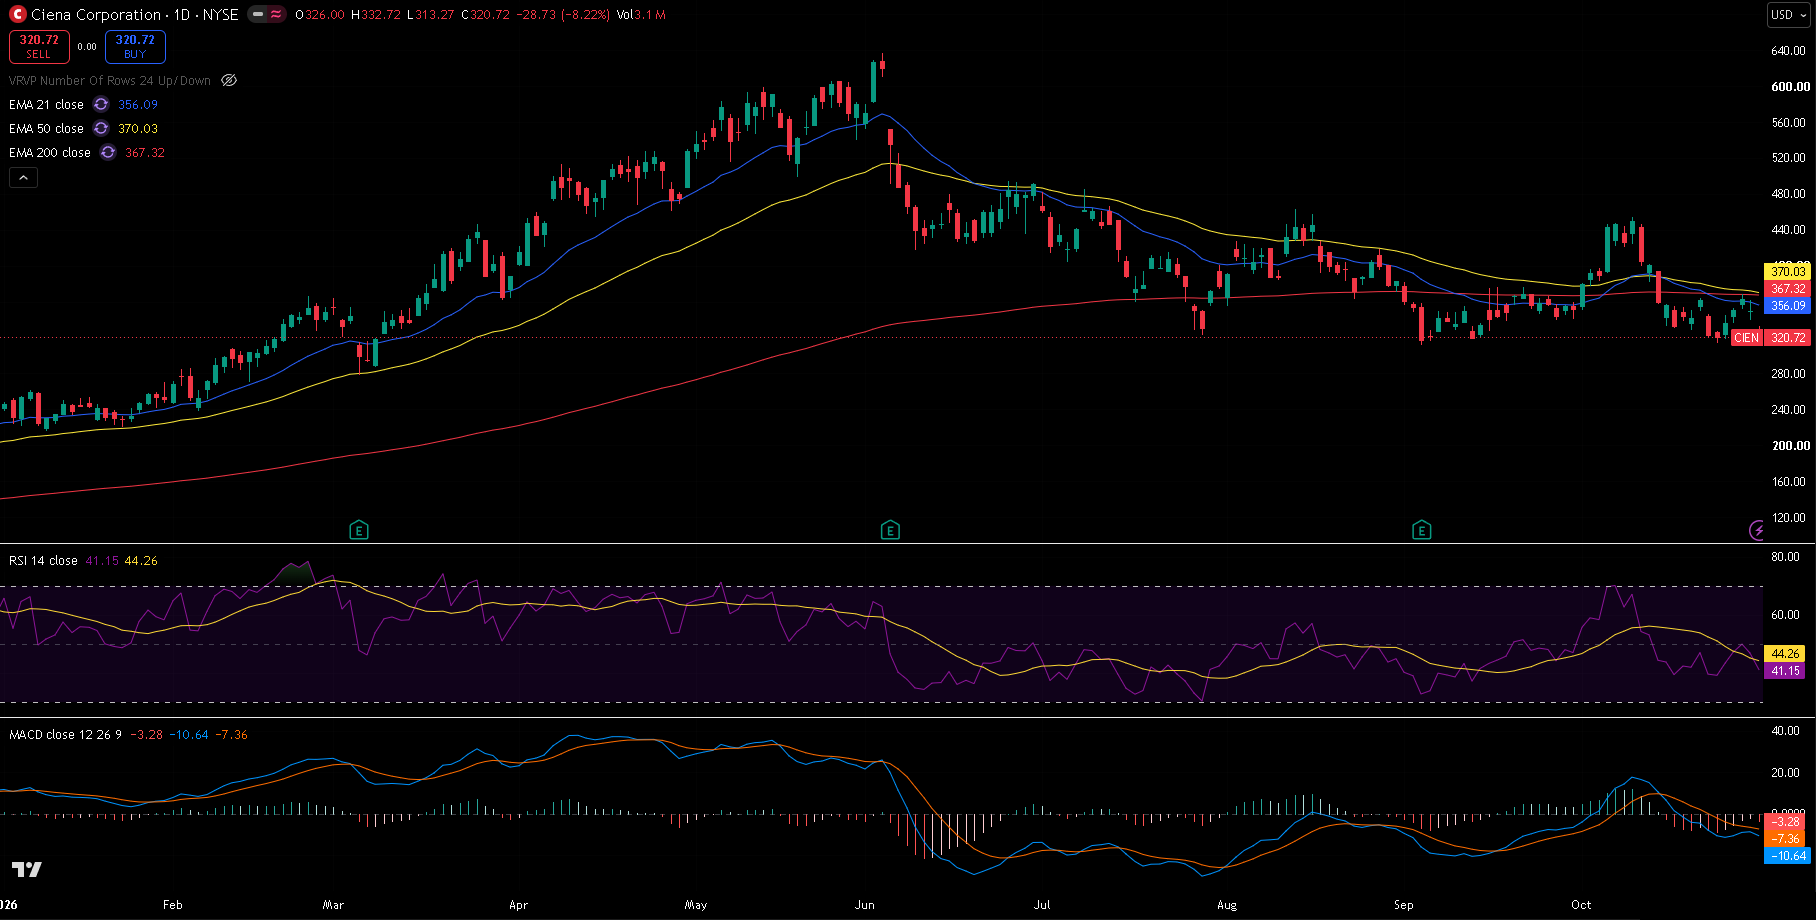
CIEN daily chart, 30 October 2026 close — 21/50/200 EMA, RSI(14) with its moving average, and MACD(12,26,9). After the June peak the stock has settled into a wide range, with the floor tested again on Friday.
Trend and Structure
Ciena nearly tripled between January and June, peaking at 637.51 on 3 June. The second half of the year has been a slow unwind: lower highs at 485.69 in July, 462.69 in August and 454.73 on 9 October, and lows at 323.29 on 29 July, 311.60 on 3 September and 313.45 on 23 October. Friday's low at 313.26 sits right on that floor. The stock is now below the 21 EMA (356.09), the 200 EMA (367.32) and the 50 EMA (370.03). Daily moves of 4–10% have been common in October, so levels can be reached quickly.
Key Levels
The level that matters most is the 311–314 floor, from the September and October lows. Overhead, the 366–370 cluster — the 61.8% retracement and the 50 and 200 EMAs — is the main resistance.
| Type | Level | Why it matters |
|---|---|---|
| Resistance | 454.73 | 9 October high |
| Resistance | 388.51 | 23.6% retracement of the June–September fall |
| EMA 50 | 370.03 | Medium-term trend |
| Resistance | 368.24 | 28 October high, where last week's bounce stopped |
| EMA 200 | 367.32 | Long-term trend |
| Fib 61.8% | 366.28 | Retracement of the September–October rally |
| EMA 21 | 356.09 | Short-term trend |
| Fib 78.6% | 342.23 | Deepest retracement of the October rally |
| Current | 320.72 | Last close |
| Support | 313.26 | Friday's low; with the 23 October low at 313.45 |
| Support | 311.60 | 3 September low, bottom of the range |
| Support | 278.39 | 5 March low |
Retracement levels marked 61.8% and 78.6% are drawn from the 3 September low at 311.60 to the 9 October high at 454.73.
Momentum and Volume
RSI(14) is at 41.15, below its own average of 44.26. MACD is at -10.64 against a signal line of -7.36, a histogram of -3.28, below zero and widening. Friday's 3.1 million shares was in line with the 20-day average of about 3.2 million, so the 8.2% drop was not driven by unusually heavy selling.
Bull Case
The 311–314 floor holds for a third time and price closes above last week's 368.24 high, back over the 50 and 200 EMAs. That would open 388.51, with the 9 October high at 454.73 above.
Bear Case
A daily close below 311.60 breaks the range floor. With little support in between, the 5 March low at 278.39 would be the next level on the chart.
Trade Scenarios
| Direction | Trigger | Stop | Target |
|---|---|---|---|
| Long | Daily close above 368.24 | 335.00 | 388.51, then 454.73 |
| Short | Daily close below 311.60 | 345.00 | 278.39 |
Risk warning: Technical analysis reflects probability, not certainty. Levels are reference points, not signals. Capital at risk. This is educational content, not investment advice.