Broadcom fell 5.5% on Friday to 326.08 and touched 319.30, its lowest level since April. The stock has made lower highs since June's 495.00 peak, and last week's bounce stalled at 352.40, well short of the 200 EMA and the 360 level. The 319–320 lows are the line to hold; below them, the April low at 301.75 is next.
Daily Chart
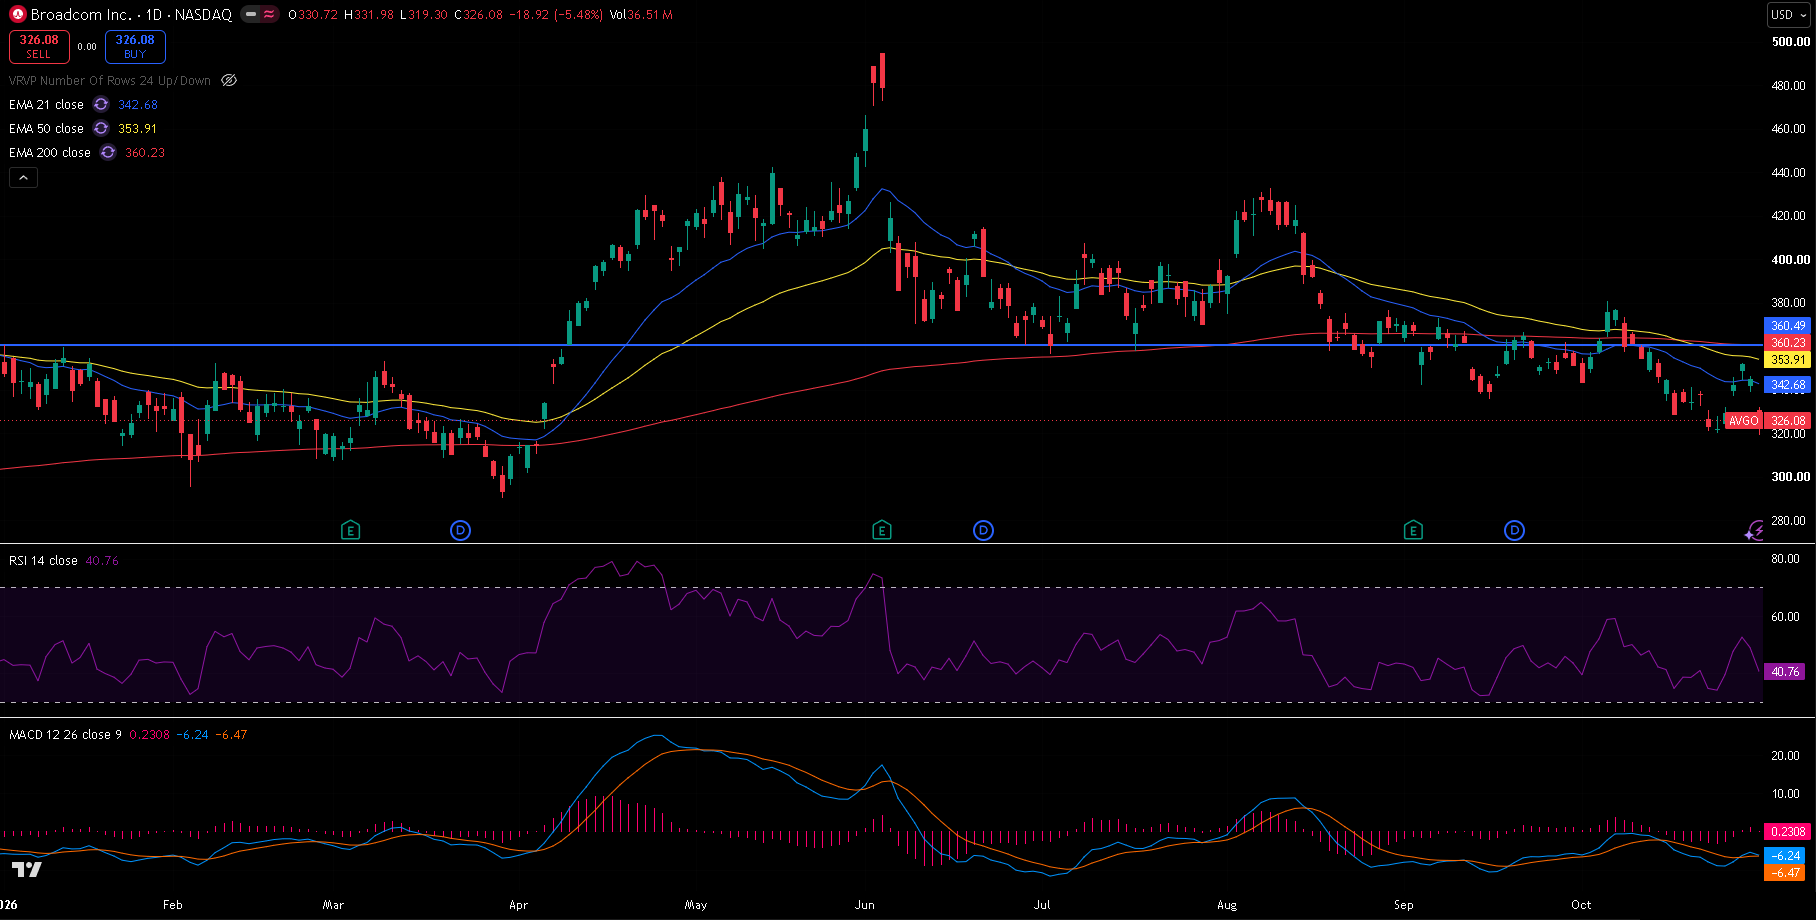
AVGO daily chart, 30 October 2026 close — 21/50/200 EMA, RSI(14) and MACD(12,26,9), with the horizontal level at 360.49. The 200 EMA now sits almost exactly on that line, making 360 a strong ceiling.
Trend and Structure
Broadcom peaked at 495.00 on 3 June and has been stepping lower since, with highs at 432.73 on 10 August, 380.84 on 6 October and 352.40 on 28 October. The 360 level on the chart, which held as a rough floor for much of the summer, gave way in late August and has mostly capped the stock since. The EMAs are now stacked bearishly — 21 (342.68) under 50 (353.91) under 200 (360.23) — and price is below all three. Friday's low at 319.30 was the lowest since April and just under the 23 October low at 320.23.
Key Levels
The level that matters most is 319–320, the 23 October and 30 October lows. Overhead, the 360 area — the horizontal line and the 200 EMA together — is the level that would change the trend.
| Type | Level | Why it matters |
|---|---|---|
| Resistance | 380.84 | 6 October high |
| Fib 61.8% | 368.28 | Retracement of the March–June rally |
| Resistance | 360.49 | Horizontal level on the chart |
| EMA 200 | 360.23 | Long-term trend, right on the 360 line |
| EMA 50 | 353.91 | Medium-term trend |
| Resistance | 352.40 | 28 October high, where last week's bounce stalled |
| EMA 21 | 342.68 | Short-term trend |
| Fib 78.6% | 333.84 | Deepest retracement before the rally is undone |
| Current | 326.08 | Last close |
| Support | 320.23 | 23 October low |
| Support | 319.30 | Friday's low, lowest since April |
| Support | 301.75 | 2 April low |
| Support | 289.96 | 30 March low, the 2026 low |
Fibonacci levels are drawn from the 30 March low at 289.96 to the 3 June high at 495.00.
Momentum and Volume
RSI(14) is at 40.76, below 50 but not oversold. MACD is at -6.24 against a signal line of -6.47, a histogram of +0.23: below zero and roughly flat, so the selling has slowed rather than reversed. Friday's 36.5 million shares was about 1.6 times the 20-day average of 22.2 million.
Bull Case
The 319–320 lows hold and price closes above last week's 352.40 high. That would end the run of lower highs and open the 360 level and 200 EMA, with the 6 October high at 380.84 above.
Bear Case
A daily close below 319.30 confirms the downtrend and opens the 2 April low at 301.75. Below there, the 30 March low at 289.96 would mean the entire spring rally has been given back.
Trade Scenarios
| Direction | Trigger | Stop | Target |
|---|---|---|---|
| Long | Daily close above 352.40 | 330.00 | 360.49, then 380.84 |
| Short | Daily close below 319.30 | 338.00 | 301.75, then 289.96 |
Risk warning: Technical analysis reflects probability, not certainty. Levels are reference points, not signals. Capital at risk. This is educational content, not investment advice.