Amazon broke out of the bottom of its two-month range this week. Thursday fell 4.2% through the 244 floor and the 200 EMA, and Friday gapped down to 229.36 before buyers pulled it back to close at 240.35. That close sits right on the 78.6% retracement of the summer rally, with the 225–226 lows just below.
Daily Chart
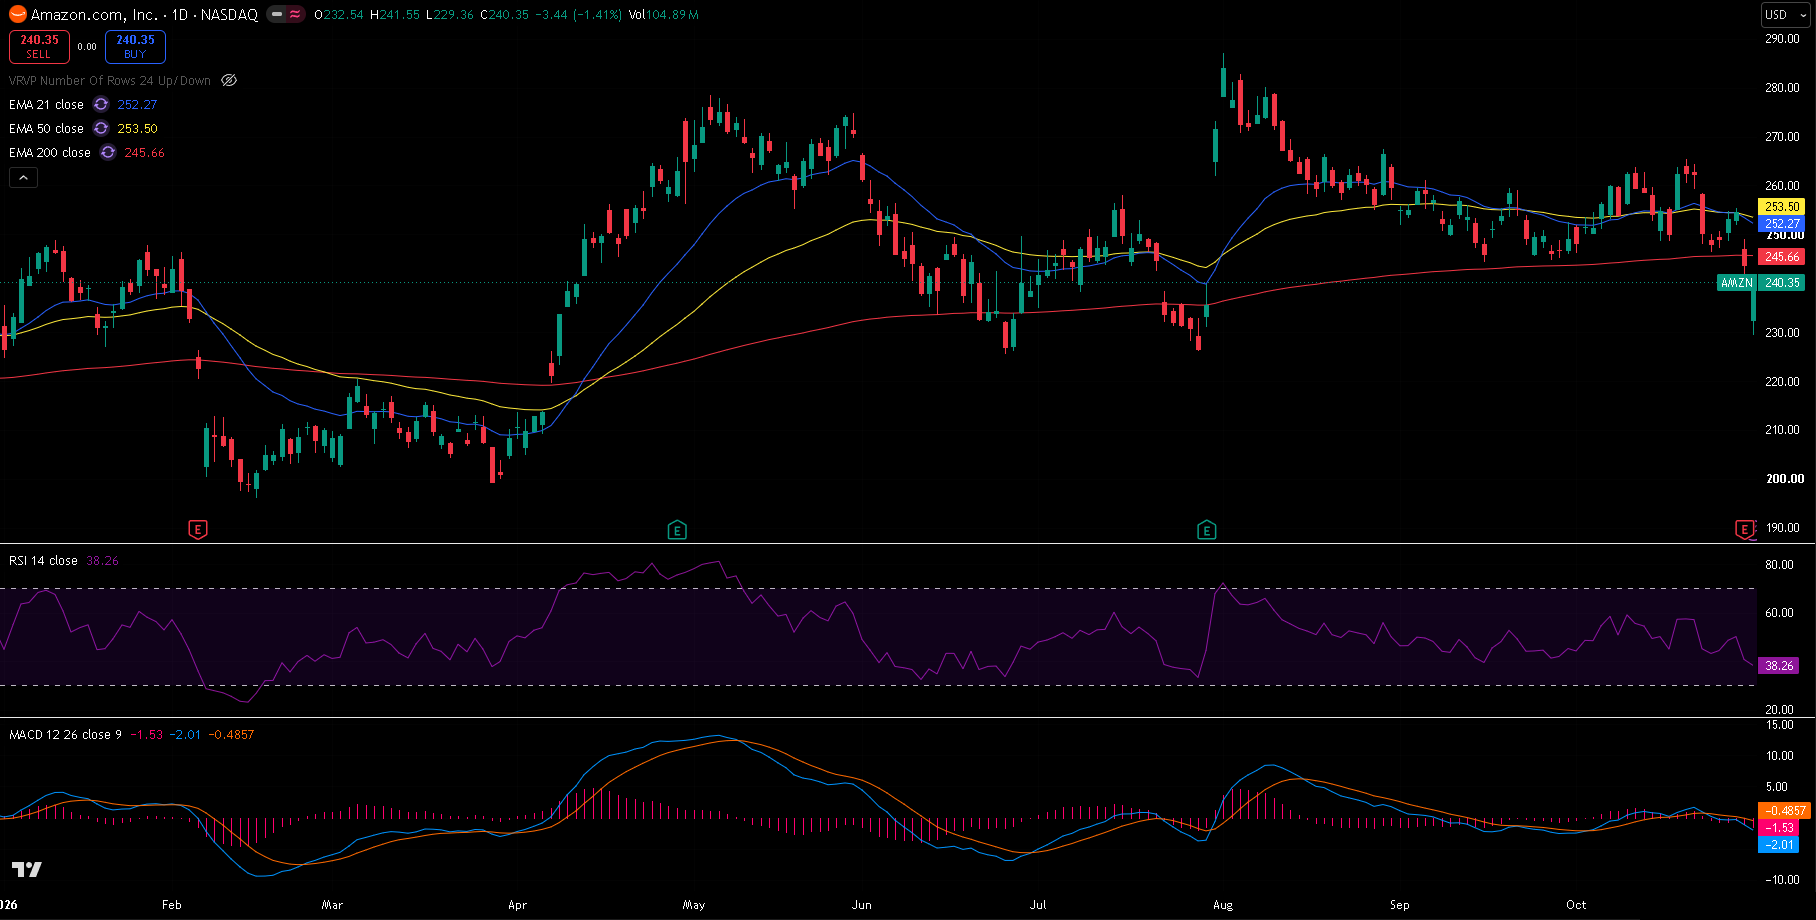
AMZN daily chart, 30 October 2026 close — 21/50/200 EMA, RSI(14) and MACD(12,26,9). Friday's long lower wick shows buyers stepping in below 230, but the close is still under all three EMAs.
Trend and Structure
From late August to last week Amazon traded sideways between about 244 and 267, with lows at 244.30 on 16 September and 244.72 on 28 September and a high of 265.34 on 20 October. Thursday's drop to 243.79 broke that floor, and Friday opened at 232.54, below the 200 EMA (245.66). The recovery from 229.36 to 240.35 was strong, but the stock is now below the 21 EMA (252.27), the 50 EMA (253.50) and the 200 EMA, with the 21 already under the 50. The old range floor at 244–246, together with the 200 EMA, is now the first resistance.
Key Levels
The level that matters most is 244–246, where the broken range floor and the 200 EMA meet. Below, the June and July lows at 225.55–226.16 are the next real support.
| Type | Level | Why it matters |
|---|---|---|
| Resistance | 287.20 | 3 August high, the 2026 high |
| Resistance | 265.34 | 20 October high, top of the recent range |
| Fib 50% | 256.68 | Half-way back on the July–August rally |
| EMA 50 | 253.50 | Medium-term trend |
| EMA 21 | 252.27 | Short-term trend, now under the 50 |
| Fib 61.8% | 249.48 | Retracement level inside the old range |
| EMA 200 | 245.66 | Long-term trend, lost on Thursday |
| Resistance | 244.30 | 16 September low, the broken range floor |
| Current | 240.35 | Last close |
| Fib 78.6% | 239.22 | Deepest retracement before the rally is undone |
| Support | 229.36 | Friday's low |
| Support | 225.55 | 25 June low; with the 29 July low at 226.16 |
| Support | 204.90 | 2 April low |
Fibonacci levels are drawn from the 29 July low at 226.16 to the 3 August high at 287.20.
Momentum and Volume
RSI(14) is at 38.26, weak but not oversold. MACD is at -2.01 against a signal line of -0.49, a histogram of -1.53, having slipped below zero this week. Volume was heavy: 85.2 million shares on Thursday and 104.9 million on Friday, against a 20-day average of about 41.7 million. Friday's heavy volume came with a close well off the low, so both sellers and dip buyers were busy.
Bull Case
Friday's low at 229.36 holds and price closes back above the 200 EMA at 245.66, back inside the old range. That would make this week look like a shake-out and open the EMAs at 252–254, then the 20 October high at 265.34.
Bear Case
The 244–246 area caps any bounce and price closes below 229.36. That opens the June and July lows at 225.55–226.16, and a break there would leave the 2 April low at 204.90 as the next support on the chart.
Trade Scenarios
| Direction | Trigger | Stop | Target |
|---|---|---|---|
| Long | Daily close above 245.66 | 234.00 | 253.50, then 265.34 |
| Short | Daily close below 229.36 | 246.00 | 225.55, then 204.90 |
Risk warning: Technical analysis reflects probability, not certainty. Levels are reference points, not signals. Capital at risk. This is educational content, not investment advice.