AMD gapped down 10.9% on Friday, from 566.42 to 504.80, wiping out the whole of last week's bounce. The intraday low at 492.21 undercut the 22 October low of 502.60, and price is now well below both short-term EMAs. The 487–502 band is the support that matters; a break opens the August and September lows near 440–451.
Daily Chart
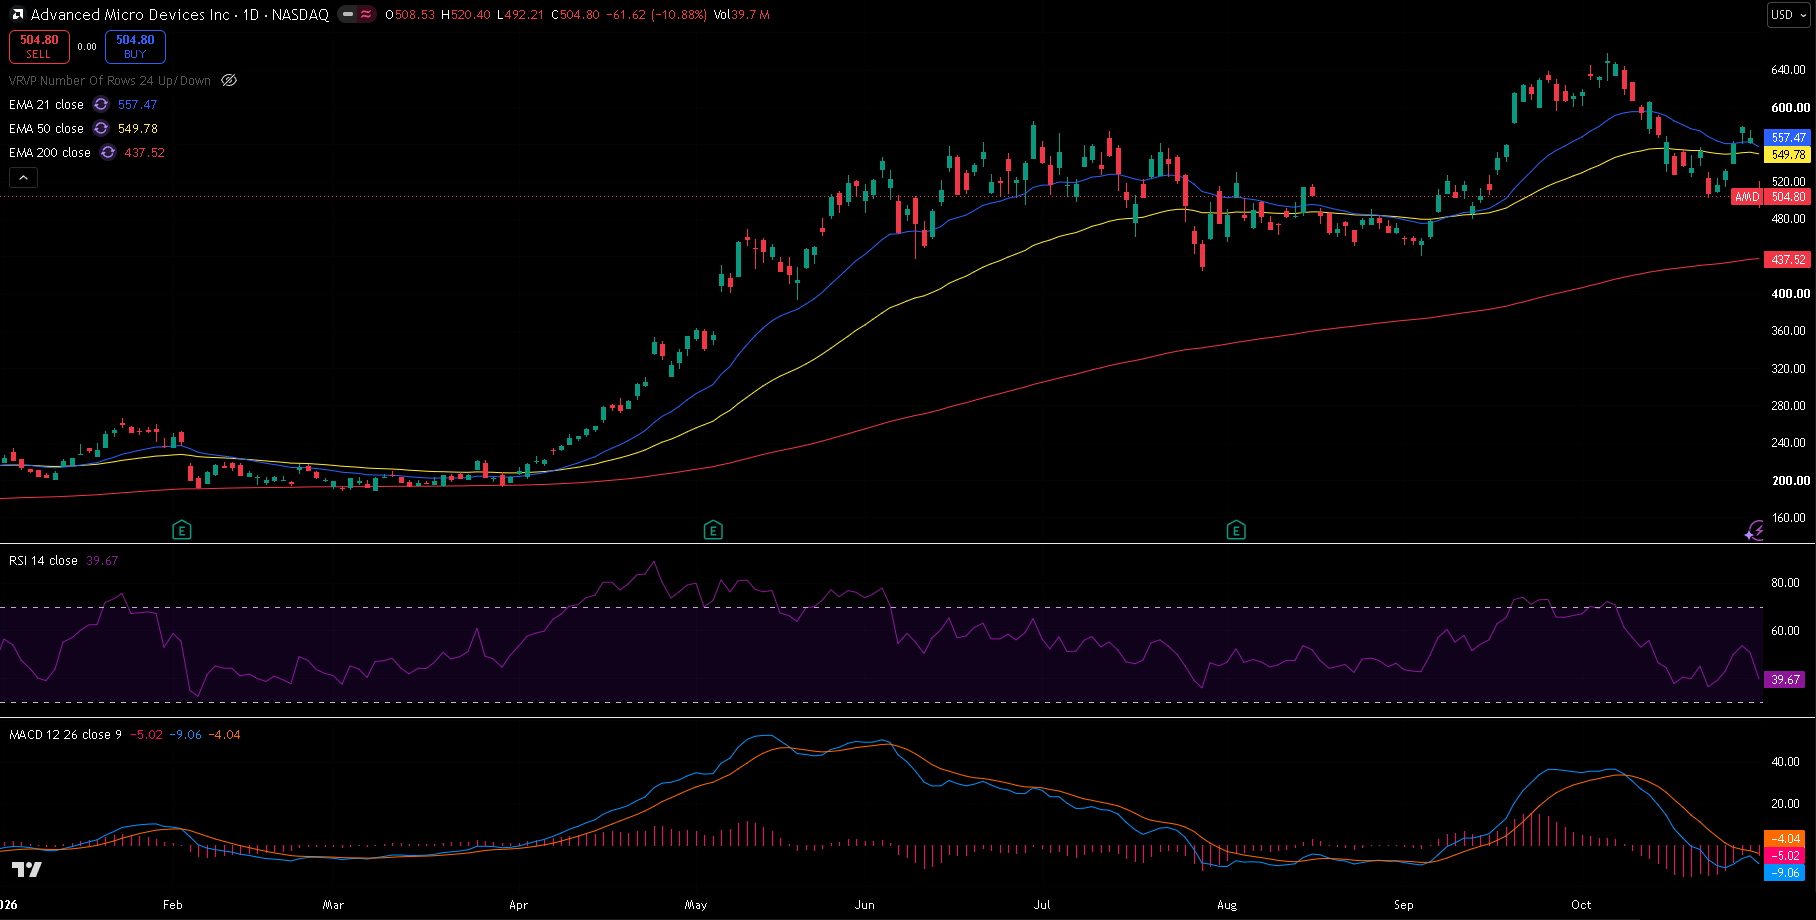
AMD daily chart, 30 October 2026 close — 21/50/200 EMA, RSI(14) and MACD(12,26,9). The stock is more than three times its March low, but Friday's gap has put it back below the 21 and 50 EMAs.
Trend and Structure
AMD's big trend is still up: it ran from 188.22 in early March to 658.52 on 6 October, and the 200 EMA (437.52) is far below and rising. The shorter picture has turned. Since the October peak the stock has made a lower high at 579.18 on 28 October and a lower low at 492.21 on Friday. Friday's gap put price under the 21 EMA (557.47) and the 50 EMA (549.78), with the 21 close to crossing below the 50. Swings of 5–10% in a day have been common, so wide stops are needed.
Key Levels
The level that matters most is the 487–502 band: the 22 October low (502.60), Friday's low (492.21) and the 78.6% retracement (487.15). Overhead, 549–558 — both EMAs and the 50% level — is the first real resistance.
| Type | Level | Why it matters |
|---|---|---|
| Resistance | 658.52 | 6 October high, the 2026 high |
| Resistance | 579.18 | 28 October high, the latest lower high |
| EMA 21 | 557.47 | Short-term trend |
| EMA 50 | 549.78 | Medium-term trend; with the 50% level at 549.51 |
| Fib 61.8% | 523.78 | Lines up with the 23 October high at 523.92 |
| Current | 504.80 | Last close |
| Support | 502.60 | 22 October low |
| Support | 492.21 | Friday's low |
| Fib 78.6% | 487.15 | Deepest retracement before the rally is undone |
| Support | 451.00 | 24 August low |
| Support | 440.50 | 3 September low, start of the last rally |
| EMA 200 | 437.52 | Long-term trend, still rising |
Fibonacci levels are drawn from the 3 September low at 440.50 to the 6 October high at 658.52.
Momentum and Volume
RSI(14) is at 39.67, below 50 and falling but not oversold. MACD is at -9.06 against a signal line of -4.04, a histogram of -5.02, below zero and widening after last week's brief recovery faded. Friday's 39.7 million shares was almost double the 20-day average of about 20.5 million, so the gap came with real selling behind it.
Bull Case
The 487–502 band holds, as it did on 22 October, and price recovers back above the 61.8% level and 23 October high at 523.78–523.92. A daily close above the EMAs at 557.47 would put the 28 October high at 579.18 back in play.
Bear Case
A daily close below 487.15 breaks the 78.6% level and leaves most of the September–October rally undone. That opens the 24 August low at 451.00, then the 3 September low at 440.50, right on top of the 200 EMA.
Trade Scenarios
| Direction | Trigger | Stop | Target |
|---|---|---|---|
| Long | Daily close above 523.92 | 490.00 | 557.47, then 579.18 |
| Short | Daily close below 487.15 | 525.00 | 451.00, then 440.50 |
Risk warning: Technical analysis reflects probability, not certainty. Levels are reference points, not signals. Capital at risk. This is educational content, not investment advice.