Uber closed at 65.25 on Friday, its lowest close since 8 April 2025. Thursday's low of 64.04 was the lowest price since that same month. October has been a slow grind lower, and the stock has now slipped out of the 67–82 range it held for most of 2026. The 50% retracement at 61.01 and the April 2025 low at 60.63 are the next supports.
Daily Chart
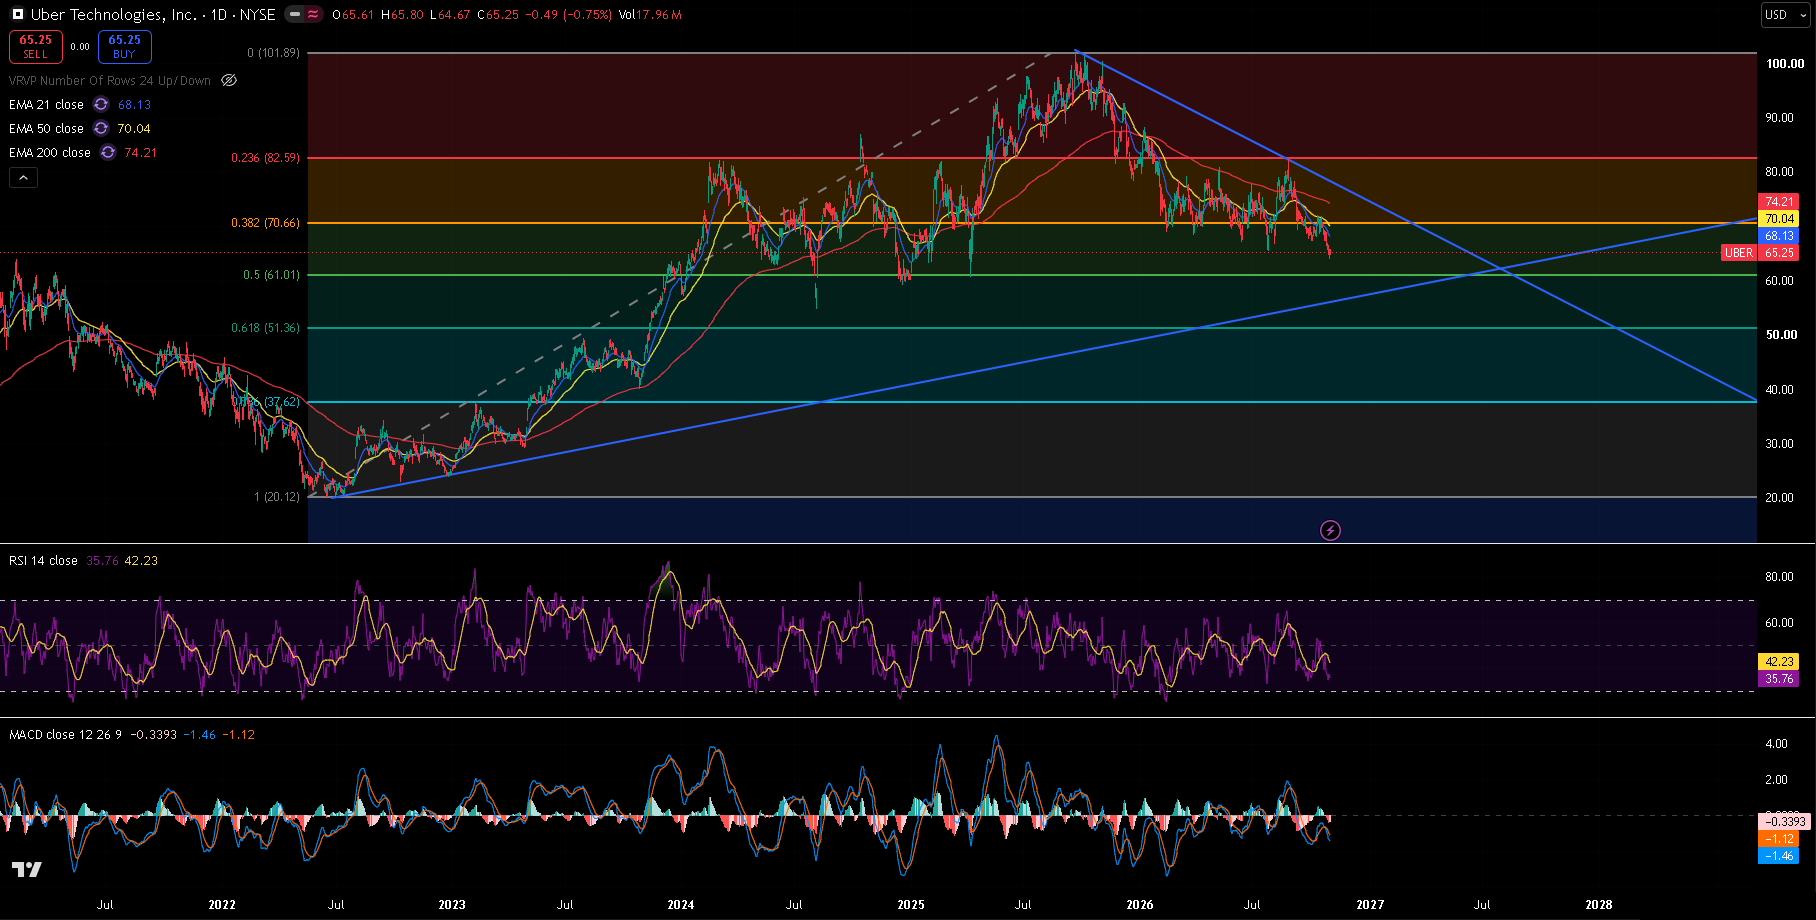
UBER daily chart since 2021, 30 October 2026 close — 21/50/200 EMA, RSI(14) with its moving average, MACD(12,26,9), the falling trendline from the September 2025 high, the rising trendline from the 2022 low, and a Fibonacci retracement from the 2022 low (20.12) to the 2025 high (101.89).
Trend and Structure
Uber has been in a downtrend since its 22 September 2025 high at 101.99. The falling trendline from that high stopped the August rally at 82.36 and is now near 78. Through 2026 the stock moved sideways between roughly 67 and 82, with repeated lows close to the 38.2% retracement at 70.66. October broke that floor. Price is under the 21 EMA (68.13), the 50 EMA (70.04) and the 200 EMA (74.21), and the three are stacked in bearish order.
The selling has been steady rather than sharp: no single big drop, just lower closes on above-average volume. Further down, the rising trendline from the 2022 low, now near 56, is the long-term support.
Key Levels
The level that matters most is 60.6–61: the 50% retracement and the April 2025 low. Overhead, the 21 EMA and the 70–70.7 zone (50 EMA and 38.2% retracement) are the first resistance.
| Type | Level | Why it matters |
|---|---|---|
| Fibonacci | 82.59 | 23.6% retracement |
| Resistance | 82.36 | 26 August high, stopped at the trendline |
| Trendline | ~78 | Falling trendline from the September 2025 high |
| EMA 200 | 74.21 | Long-term trend |
| Resistance | 72.08 | 9 October high |
| Fibonacci | 70.66 | 38.2% retracement, the 2026 floor, now lost |
| EMA 50 | 70.04 | Medium-term trend |
| EMA 21 | 68.13 | Short-term trend |
| Current | 65.25 | Last close, lowest since April 2025 |
| Support | 64.04 | 29 October low |
| Fibonacci | 61.01 | 50% retracement |
| Support | 60.63 | 7 April 2025 low |
| Trendline | ~56 | Rising trendline from the 2022 low |
| Fibonacci | 51.36 | 61.8% retracement |
Trendline levels are approximate and read from the chart.
Momentum and Volume
RSI(14) is at 35.76, below its own average of 42.23 and getting close to oversold. MACD is at -1.46 against a signal line of -1.12, a histogram of -0.34, below zero. Volume has run above the 20-day average of about 16.2 million most days in the last week, peaking at 22.1 million on 26 October, which points to steady selling rather than a single shock.
Bull Case
The 61–64 area holds and RSI turns up from near oversold. A daily close back above 70.66 would put the stock back inside its 2026 range and over the 50 EMA, opening the 200 EMA at 74.21 and the falling trendline near 78.
Bear Case
A daily close below Thursday's 64.04 low keeps the slide going towards the 50% retracement at 61.01 and the April 2025 low at 60.63. Below that, the rising trendline from 2022 near 56 is the next major support.
Trade Scenarios
| Direction | Trigger | Stop | Target |
|---|---|---|---|
| Long | Daily close above 70.66 | 64.00 | 74.21, then ~78 |
| Short | Daily close below 64.04 | 68.20 | 61.01, then ~56 |
Risk warning: Technical analysis reflects probability, not certainty. Levels are reference points, not signals. Capital at risk. This is educational content, not investment advice.