Stryker gapped down on Friday and closed 6.4% lower at 291.86, on 6.4 million shares, more than twice the 20-day average and the heaviest day in over a year. That undid most of the October bounce from the 267–271 lows, where the rising trendline from the 2020 low and the 61.8% retracement meet. Price has slipped back under the 21 and 50 EMAs and the 50% level at 297.86.
Daily Chart
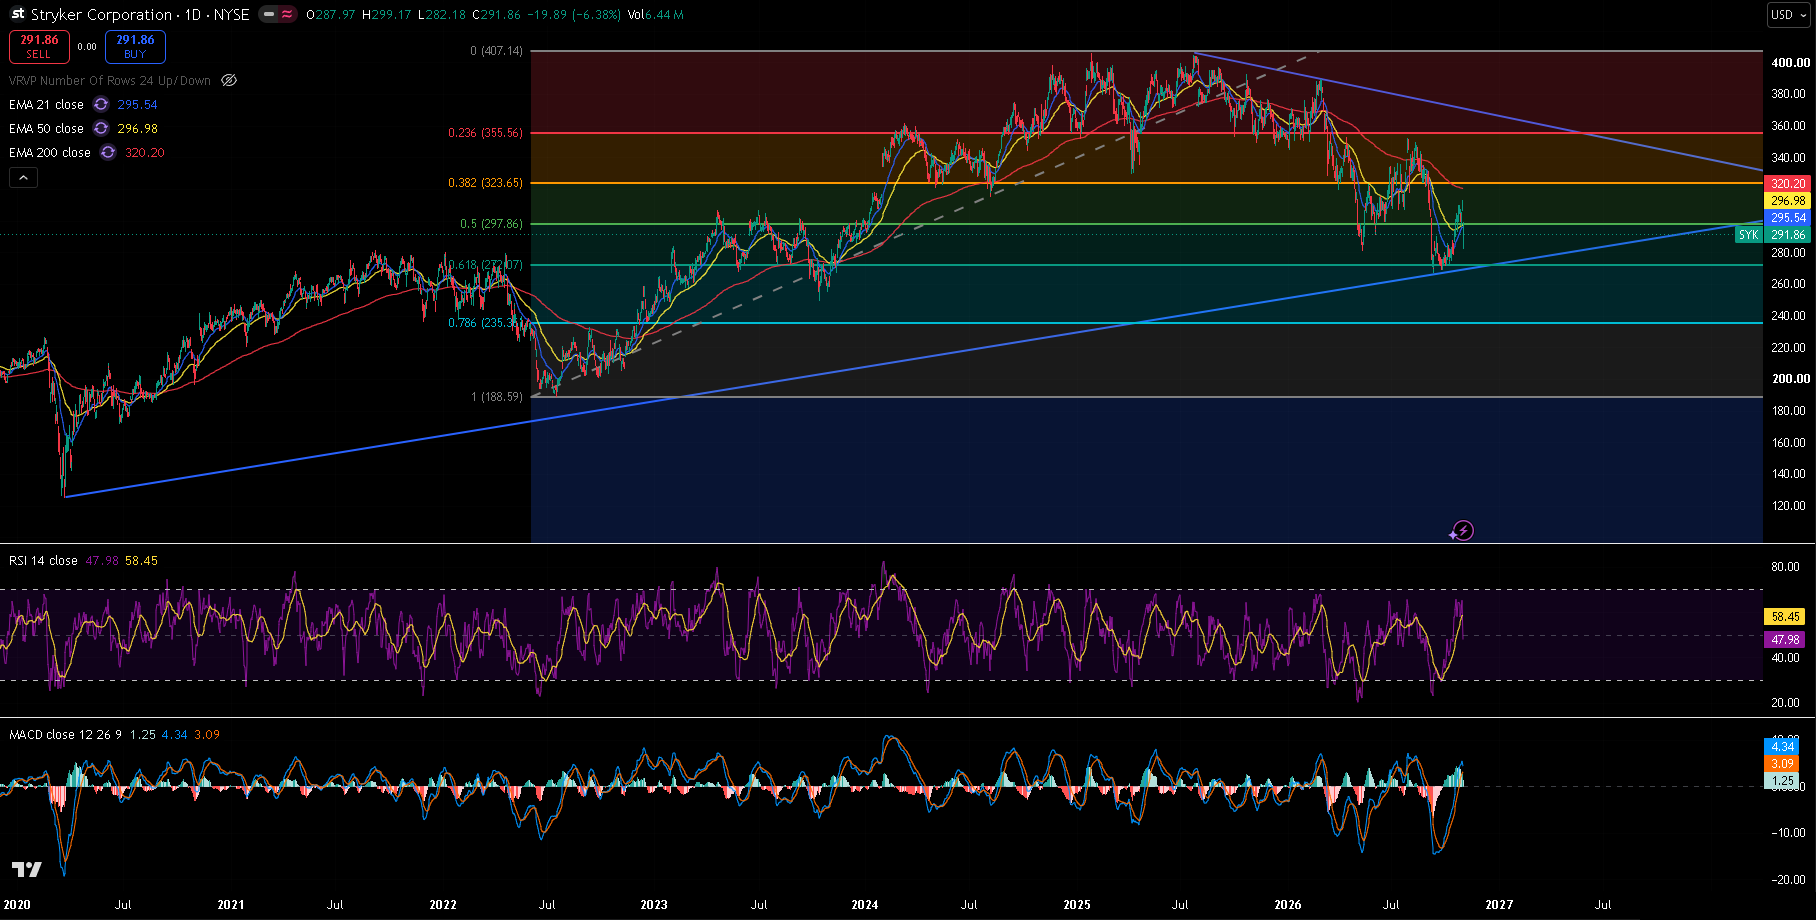
SYK daily chart since 2020, 30 October 2026 close — 21/50/200 EMA, RSI(14) with its moving average, MACD(12,26,9), the rising trendline from the March 2020 low, the falling trendline from the July 2025 high, and a Fibonacci retracement from the June 2022 low (188.59) to the 2025 high (407.14).
Trend and Structure
Stryker has been falling since its July 2025 high near 406. The falling trendline from that high stopped the February rally at 388.67 and is now around 371. The decline hit bottom in the autumn: the 11 September low at 267.00 and the 2 October low at 271.21 formed a double bottom on two strong supports at once — the rising trendline from the March 2020 low, now near 269, and the 61.8% retracement of the 2022–2025 rise at 272.07.
The bounce from there reached 312.80 on Thursday, but Friday's gap down took the stock back to 291.86. It is now under the 21 EMA (295.54), the 50 EMA (296.98) and the 200 EMA (320.20), and the 21 has dipped just below the 50. The stock is still well above the double bottom, but the bounce has lost its footing.
Key Levels
The levels that matter most are 267–272: the double bottom, the rising trendline from 2020 and the 61.8% retracement. Overhead, the 50% retracement and EMAs at 295–298, then Thursday's 312.80 high, are the resistance.
| Type | Level | Why it matters |
|---|---|---|
| Trendline | ~371 | Falling trendline from the July 2025 high |
| Fibonacci | 355.56 | 23.6% retracement |
| Resistance | 352.49 | 29 July high |
| Fibonacci | 323.65 | 38.2% retracement |
| EMA 200 | 320.20 | Long-term trend |
| Resistance | 312.80 | 29 October high, top of the bounce |
| Fibonacci | 297.86 | 50% retracement, lost on Friday |
| EMA 50 | 296.98 | Medium-term trend |
| EMA 21 | 295.54 | Short-term trend |
| Current | 291.86 | Last close |
| Support | 282.18 | Friday's low |
| Support | 281.00 | 11 May low |
| Fibonacci | 272.07 | 61.8% retracement |
| Support | 271.21 | 2 October low |
| Trendline | ~269 | Rising trendline from the March 2020 low |
| Support | 267.00 | 11 September low, the 2026 low |
| Fibonacci | 235.35 | 78.6% retracement |
Trendline levels are approximate and read from the chart.
Momentum and Volume
RSI(14) dropped to 47.98, below its own average of 58.45. MACD is still positive at 4.34 against a signal line of 3.09, a histogram of +1.25, left over from the October bounce, but Friday's fall will start to pull it down. The 6.4 million shares traded on Friday, against a 20-day average of about 2.7 million, shows how heavy the selling was.
Bull Case
Friday's low at 282.18 holds above the May low at 281.00, and the stock climbs back over the 295–298 zone. A daily close above Friday's 299.17 high would bring Thursday's 312.80 high and the 200 EMA at 320.20 back into play.
Bear Case
A close below 281.00 opens the retest of the 267–272 double bottom. A daily close below 267.00 would break both the 2020 trendline and the 61.8% retracement, which opens the 78.6% level at 235.35.
Trade Scenarios
| Direction | Trigger | Stop | Target |
|---|---|---|---|
| Long | Daily close above 299.17 | 282.00 | 312.80, then 320.20 |
| Short | Daily close below 267.00 | 285.00 | 250, then 235.35 |
Risk warning: Technical analysis reflects probability, not certainty. Levels are reference points, not signals. Capital at risk. This is educational content, not investment advice.