S&P Global closed at 466.55 on Friday, its highest close since 2 February and 22% above the 2 October low of 382.21. The rally has carried it to the top of a large triangle: the falling trendline from the August 2025 high is now near 475, and it turned the stock back on 27 October. A close through that line is the next test.
Daily Chart
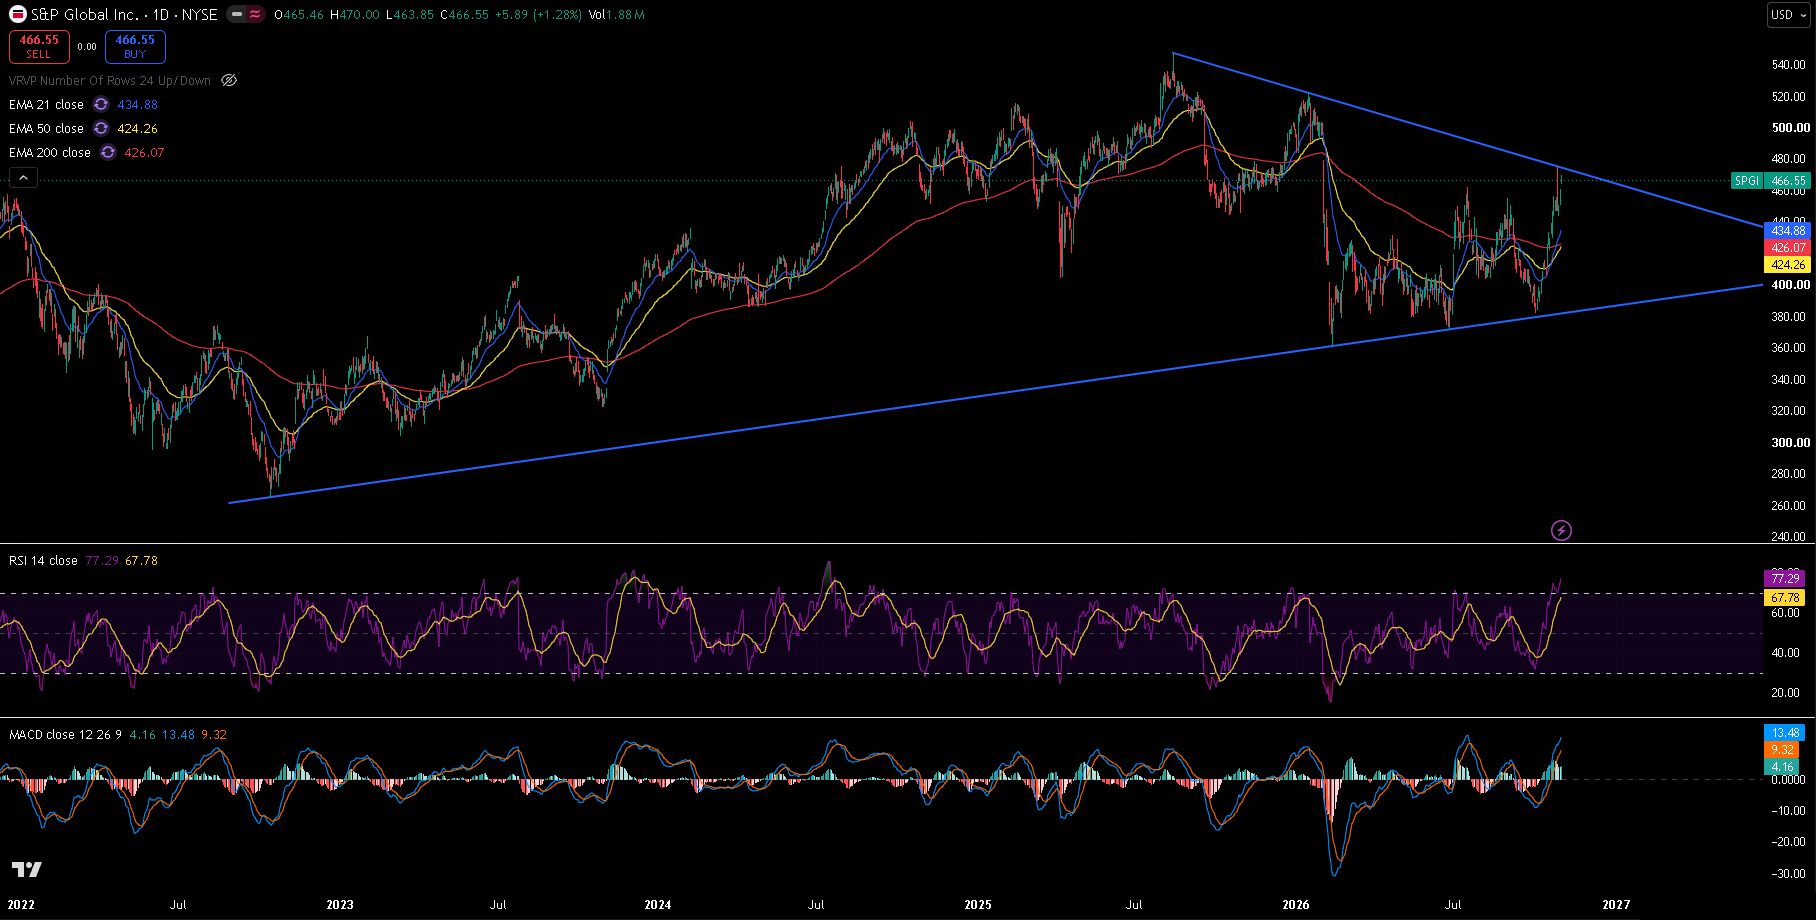
SPGI daily chart since 2022, 30 October 2026 close — 21/50/200 EMA, RSI(14) with its moving average, MACD(12,26,9), the falling trendline from the August 2025 high and the rising trendline from the 2022 low. Price is pressing against the falling line.
Trend and Structure
The chart is a contracting triangle. The falling trendline from the August 2025 high near 547 capped the January rally at 522.35 and now sits around 475. The rising trendline from the 2022 low near 261 has caught three falls this year: the 12 February low at 360.94, the 26 June low at 371.75 and the 2 October low at 382.21, each one higher than the last. October has been a clean run from the bottom of the triangle to the top. Price is above the 21 EMA (434.88), the 200 EMA (426.07) and the 50 EMA (424.26), and it has cleared the July and September highs at 462.02 and 454.92.
The warning sign is 27 October. The stock gapped up to 470, touched 474.61 right at the trendline, then sold off to close at 448.93 on 3.7 million shares, the heaviest day of the month. Friday's move back to 470 is the second go at the same line.
Key Levels
The level that matters most is the falling trendline near 475, with the 27 October high at 474.61 just under it. Below, the July high at 462.02 and the EMA cluster at 424–435 are the supports.
| Type | Level | Why it matters |
|---|---|---|
| Resistance | 522.35 | 15 January high, the 2026 high |
| Resistance | 479.43 | 3 February high |
| Trendline | ~475 | Falling trendline from the August 2025 high |
| Resistance | 474.61 | 27 October high, rejected at the trendline |
| Current | 466.55 | Last close, highest since 2 February |
| Support | 462.02 | 17 July high, now support |
| Support | 444.00 | 28 October low |
| EMA 21 | 434.88 | Short-term trend |
| EMA 200 | 426.07 | Long-term trend |
| EMA 50 | 424.26 | Medium-term trend |
| Support | 403.45 | 6 August low |
| Support | 382.21 | 2 October low |
| Trendline | ~381 | Rising trendline from the 2022 low |
Trendline levels are approximate and read from the chart.
Momentum and Volume
RSI(14) is at 77.29, overbought and above its own average of 67.78. MACD is at 13.48 against a signal line of 9.32, a histogram of +4.16, above zero and rising. Momentum is strong but stretched after a 22% move in four weeks. Friday's 1.9 million shares was close to the 20-day average of about 1.8 million, so the second test of the trendline came on ordinary volume, not a surge.
Bull Case
A daily close above about 475 breaks the falling trendline that has capped the stock since August 2025. That opens the 3 February high at 479.43, then the 500 area and the January high at 522.35. Pullbacks that hold above the July high at 462.02 would keep the breakout attempt alive.
Bear Case
A second rejection at the trendline, with RSI overbought, would repeat the 27 October pattern. A close back below 444.00 points to the EMA cluster at 424–435. The triangle stays intact unless the rising trendline near 381 gives way.
Trade Scenarios
| Direction | Trigger | Stop | Target |
|---|---|---|---|
| Long | Daily close above 476 | 460.00 | 479.43, then 522.35 |
| Short | Daily close below 444.00 | 462.00 | 434.88, then 424.26 |
Risk warning: Technical analysis reflects probability, not certainty. Levels are reference points, not signals. Capital at risk. This is educational content, not investment advice.