Strategy fell 7.8% on Friday to 130.51, its lowest close since 16 September, on 34 million shares, the heaviest day since 21 September. It dropped out of a two-week range at 133–146 and below all three EMAs. The September low at 121.38 is the next support, and the rising trendline from the June low sits underneath near 108.
Daily Chart
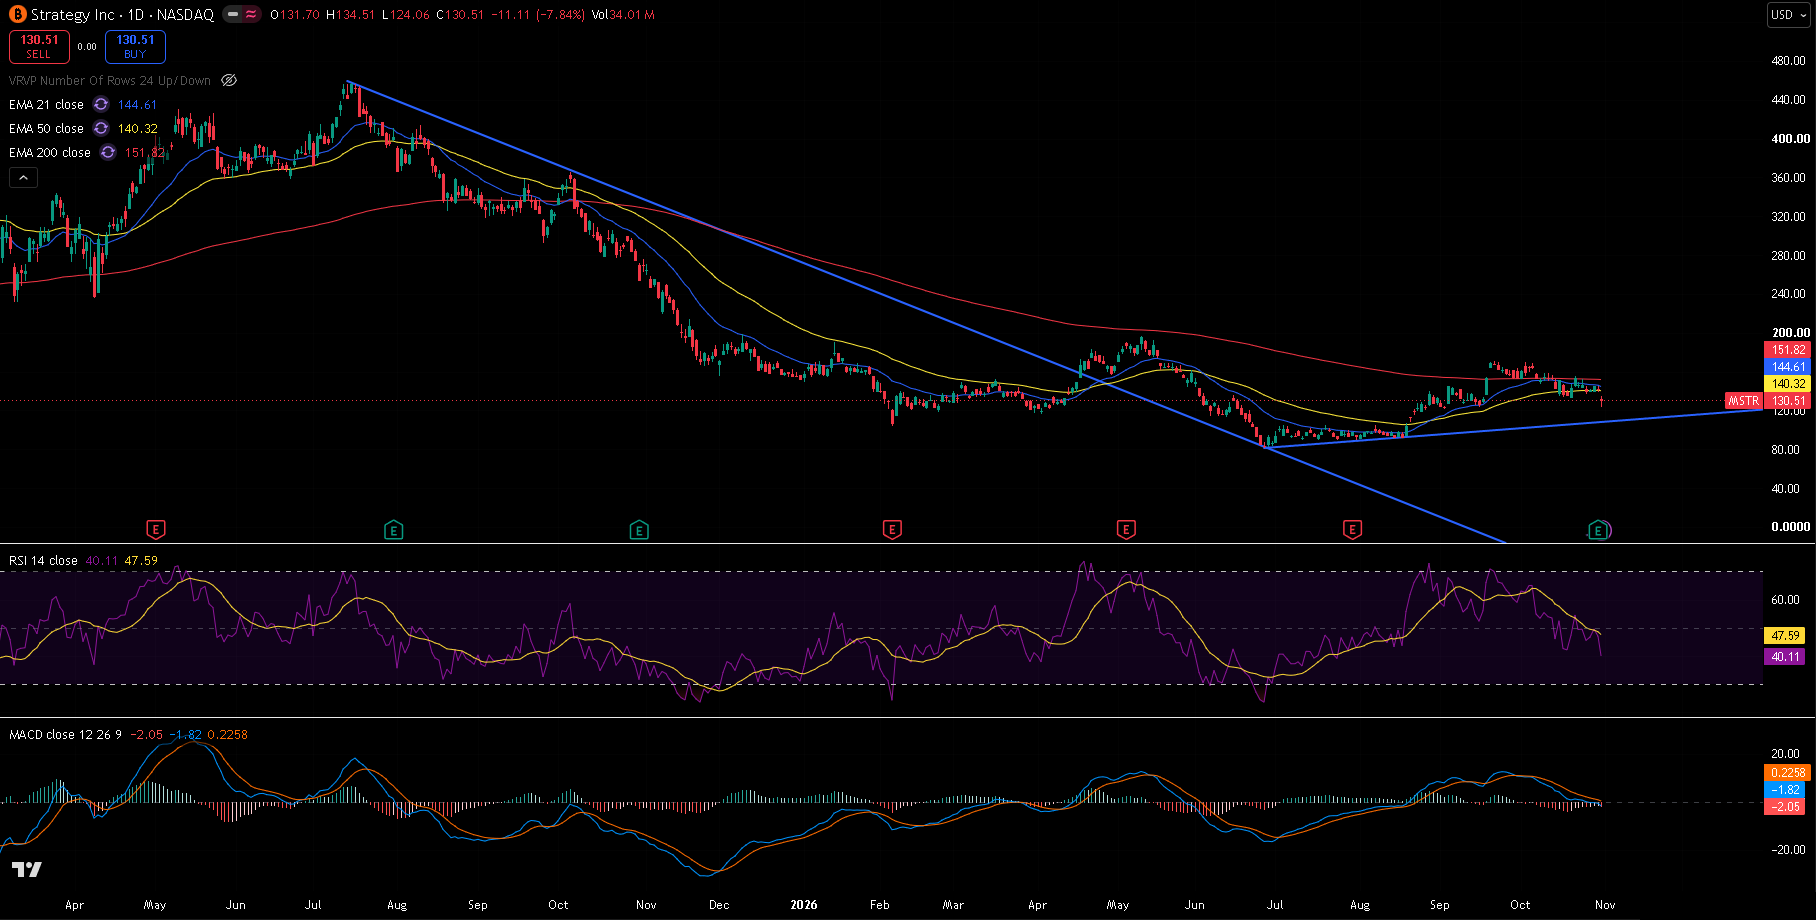
MSTR daily chart since spring 2025, 30 October 2026 close — 21/50/200 EMA, RSI(14) with its moving average, MACD(12,26,9), the falling trendline from the July 2025 high and the rising trendline from the June 2026 low.
Trend and Structure
The big picture is a long fall from the July 2025 high near 457 to the 26 June low at 81.81. The falling trendline from that high capped the stock until April, when price broke above it. The June low then landed right back on that line and held, and the stock has been building higher lows since along a new rising trendline, now near 108.
The recovery stalled at 170–171: the 22 September high was 171.19 and the 2 October high was 170.17. Since then the stock has slipped back under the 200 EMA (151.82), and Friday's drop took it below the 21 EMA (144.61) and the 50 EMA (140.32) as well. The 21 is still above the 50, but only just.
Key Levels
The level that matters most is the September low at 121.38, just under Friday's 124.06 low. Overhead, the 20 October low at 133.59 and the EMAs at 140–152 are now resistance.
| Type | Level | Why it matters |
|---|---|---|
| Resistance | 197.00 | 11 May high, the 2026 high |
| Resistance | 171.19 | 22 September high, double top with 170.17 on 2 October |
| EMA 200 | 151.82 | Long-term trend, lost in October |
| EMA 21 | 144.61 | Short-term trend |
| EMA 50 | 140.32 | Medium-term trend, lost on Friday |
| Resistance | 133.59 | 20 October low, bottom of the old range |
| Current | 130.51 | Last close |
| Support | 124.06 | Friday's low |
| Support | 121.38 | 2 September low |
| Trendline | ~108 | Rising trendline from the June low |
| Support | 90.93 | 3 August low |
| Support | 81.81 | 26 June low, the 2026 low |
Trendline levels are approximate and read from the chart.
Momentum and Volume
RSI(14) is at 40.11, below its own average of 47.59 and falling, but not yet oversold. MACD is at -1.82 against a signal line of 0.23, a histogram of -2.05; it has just slipped below zero. Friday's 34 million shares was nearly twice the 20-day average of about 18.8 million, so the break came with real selling behind it.
Bull Case
Buyers defend the September low at 121.38 and the stock climbs back into its old range. A daily close above about 146 would put it back over the 21 and 50 EMAs and open the 200 EMA at 151.82, then the 170–171 double top.
Bear Case
A daily close below 121.38 undercuts the September low and leaves little support before the rising trendline near 108. A break of that line would put the August low at 90.93 and the June low at 81.81 back in view.
Trade Scenarios
| Direction | Trigger | Stop | Target |
|---|---|---|---|
| Long | Daily close above 146 | 124.00 | 151.82, then 170 |
| Short | Daily close below 121.38 | 134.00 | ~108, then 90.93 |
Risk warning: Technical analysis reflects probability, not certainty. Levels are reference points, not signals. Capital at risk. This is educational content, not investment advice.