Robinhood fell 7.2% on Friday to 84.99 and touched 82.00, its lowest price since June, landing right on the rising trendline from the April 2025 low. The stock is down a third from its 23 September high of 126.74 and below all three EMAs, with RSI under 30. This trendline, near 83.5, is the support that has to hold.
Daily Chart
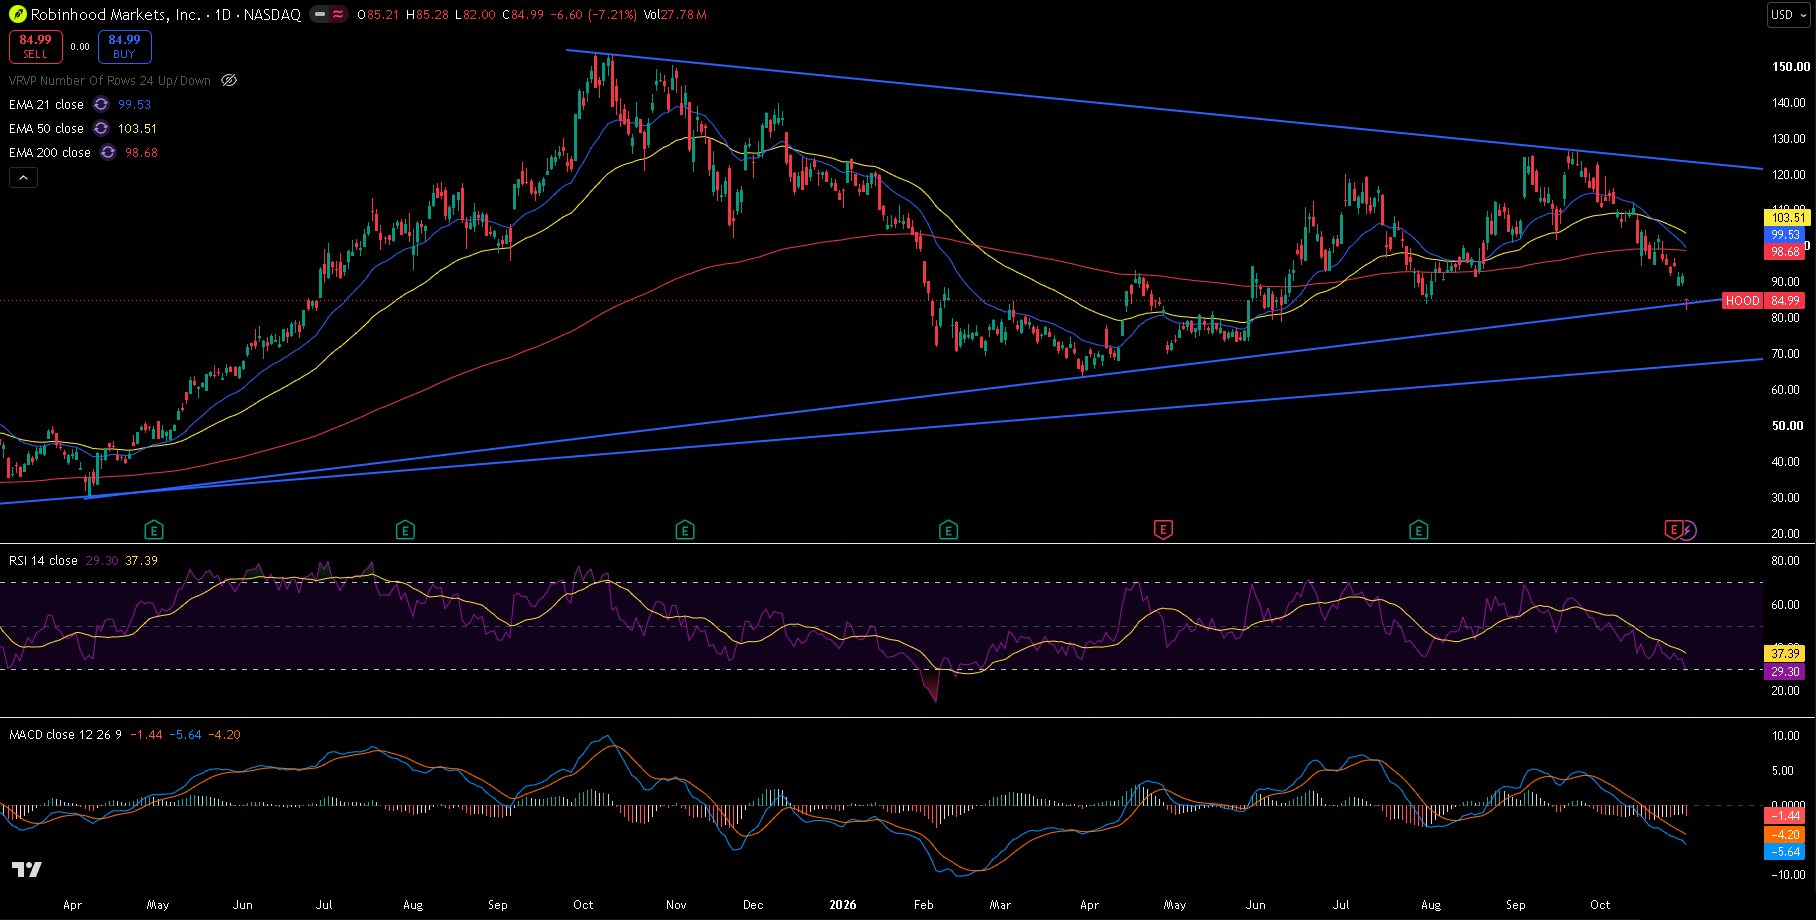
HOOD daily chart since spring 2025, 30 October 2026 close — 21/50/200 EMA, RSI(14) with its moving average, MACD(12,26,9), the falling trendline from the autumn 2025 high and two rising trendlines from the 2024 and 2025 lows. Friday's low tagged the upper rising line.
Trend and Structure
Robinhood's chart is a big triangle: a falling trendline from the autumn 2025 high near 154 caps the rallies — it stopped the 23 September high at 126.74 — while a rising trendline from the April 2025 low has caught the falls, including the March 2026 low at 63.52. October has been a steady slide from the top of that triangle to the bottom: price is now under the 21 EMA (99.53), the 200 EMA (98.68) and the 50 EMA (103.51), and the 21 has crossed below the 50. Friday's drop took it straight to the rising trendline, now around 83.5.
Key Levels
The level that matters most is 82–83.5: Friday's low and the rising trendline from April 2025. Overhead, last week's 89–92.6 range and the 200 EMA near 99 are the resistance.
| Type | Level | Why it matters |
|---|---|---|
| Resistance | 126.74 | 23 September high |
| Trendline | ~124 | Falling trendline from the autumn 2025 high |
| EMA 50 | 103.51 | Medium-term trend |
| EMA 21 | 99.53 | Short-term trend, crossed under the 50 |
| EMA 200 | 98.68 | Long-term trend, lost in October |
| Resistance | 94.52 | 15 October low, now resistance |
| Resistance | 92.60 | 28 October high, top of last week's range |
| Current | 84.99 | Last close |
| Trendline | ~83.5 | Rising trendline from the April 2025 low |
| Support | 82.00 | Friday's low, the lowest since June |
| Support | 78.93 | 9 June low |
| Trendline | ~67 | Lower rising trendline from the 2024 low |
| Support | 63.52 | 30 March low, the 2026 low |
Trendline levels are approximate and read from the chart.
Momentum and Volume
RSI(14) is at 29.30, just inside oversold territory and below its own average of 37.39. MACD is at -5.64 against a signal line of -4.20, a histogram of -1.44, below zero and still falling. Volume has picked up on the selling: 39.8 million shares on Wednesday and 27.8 million on Friday, against a 20-day average of about 19.5 million.
Bull Case
The rising trendline holds, as it did in March, and oversold RSI brings in buyers. A daily close above last week's 92.60 high would open the 200 EMA at 98.68 and the 50 EMA at 103.51.
Bear Case
A daily close below Friday's 82.00 low breaks the trendline from April 2025, the most important support on the chart. That opens the 9 June low at 78.93, then the lower trendline near 67 and the March low at 63.52.
Trade Scenarios
| Direction | Trigger | Stop | Target |
|---|---|---|---|
| Long | Daily close above 92.60 | 82.00 | 98.68, then 103.51 |
| Short | Daily close below 82.00 | 90.00 | 78.93, then ~67 |
Risk warning: Technical analysis reflects probability, not certainty. Levels are reference points, not signals. Capital at risk. This is educational content, not investment advice.