Berkshire Hathaway's B shares rallied 11% in October, from 495.96 to a 2026 high of 550.47 on Friday, then slipped back to close at 542.49. Price has spent the past seven sessions between about 539 and 550 after clearing the August high at 537.74. The trend is up; the 537–539 area is the first support to watch.
Daily Chart
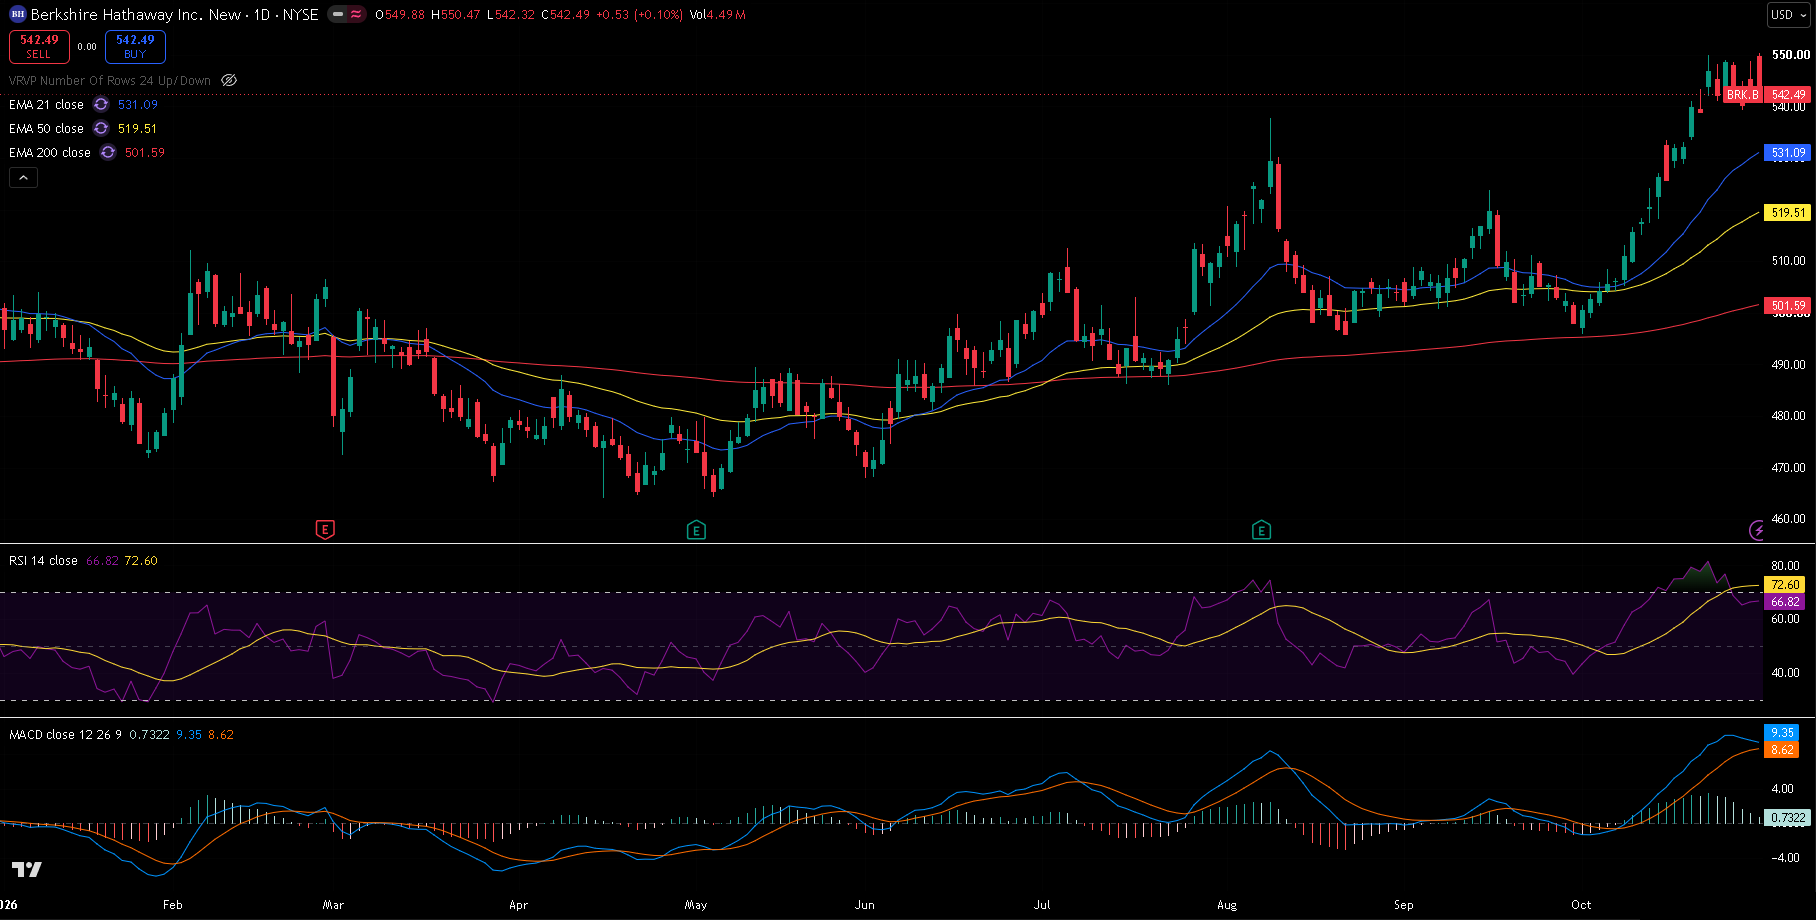
BRK.B daily chart, 30 October 2026 close — 21/50/200 EMA, RSI(14) with its moving average, and MACD(12,26,9). Price broke above the August high this month and is now pausing just under 550.
Trend and Structure
Berkshire spent the first half of 2026 in a slow range between about 464 and 512, then started to climb in the summer. The October rally broke the 10 August high at 537.74, and Friday reached 550.47 before sellers pushed it back to 542.49. The EMAs are lined up bullishly — 21 (531.09) above 50 (519.51) above 200 (501.59) — and all three are rising. A tight pause near the highs after a strong run is normal, as long as the old August high holds as support.
Key Levels
The level that matters most is 537–539: the 28 October low (539.23), the August high (537.74) and the 23.6% retracement (537.61). Overhead, Friday's 550.47 high is the breakout level.
| Type | Level | Why it matters |
|---|---|---|
| Fib 127.2% | 565.30 | Extension of the October rally |
| Resistance | 550.47 | 30 October high, the 2026 high |
| Current | 542.49 | Last close |
| Support | 539.23 | 28 October low, bottom of the recent pause |
| Support | 537.74 | 10 August high, now support; with the 23.6% level at 537.61 |
| EMA 21 | 531.09 | Short-term trend |
| Fib 38.2% | 529.65 | First meaningful retracement |
| EMA 50 | 519.51 | Medium-term trend |
| Fib 61.8% | 516.78 | Deeper retracement of the October rally |
| EMA 200 | 501.59 | Long-term trend |
| Support | 495.96 | 1 October low, start of the rally |
Fibonacci levels are drawn from the 1 October low at 495.96 to the 30 October high at 550.47.
Momentum and Volume
RSI(14) is at 66.82, cooling from above 70 earlier in the week and now under its own average of 72.60 — strong, but no longer stretched. MACD is at 9.35 against a signal line of 8.62, a histogram of +0.73: still positive, but the gap has been narrowing as the rally pauses. Friday's 4.5 million shares was in line with the 20-day average of about 4.3 million.
Bull Case
The 537–539 area holds and price closes above 550.47. That would end the pause and open the 127.2% extension of the October rally at 565.30.
Bear Case
A daily close below the 23.6% level at 537.61 would put price back under the old August high and suggest the breakout is fading. The 38.2% level at 529.65 and the 50 EMA at 519.51 come next.
Trade Scenarios
| Direction | Trigger | Stop | Target |
|---|---|---|---|
| Long | Daily close above 550.47 | 536.00 | 565.30 |
| Short | Daily close below 537.61 | 551.00 | 529.65, then 519.51 |
Risk warning: Technical analysis reflects probability, not certainty. Levels are reference points, not signals. Capital at risk. This is educational content, not investment advice.