Rocket Lab fell 7.4% on Friday to 54.73, after last week's bounce stalled at 61.13 — just under the 78.6% retracement and the broken trendline from April 2025. The stock is down almost two-thirds from its May high of 151.00 and below all three EMAs. The 20 October low at 49.25 is the key support.
Daily Chart
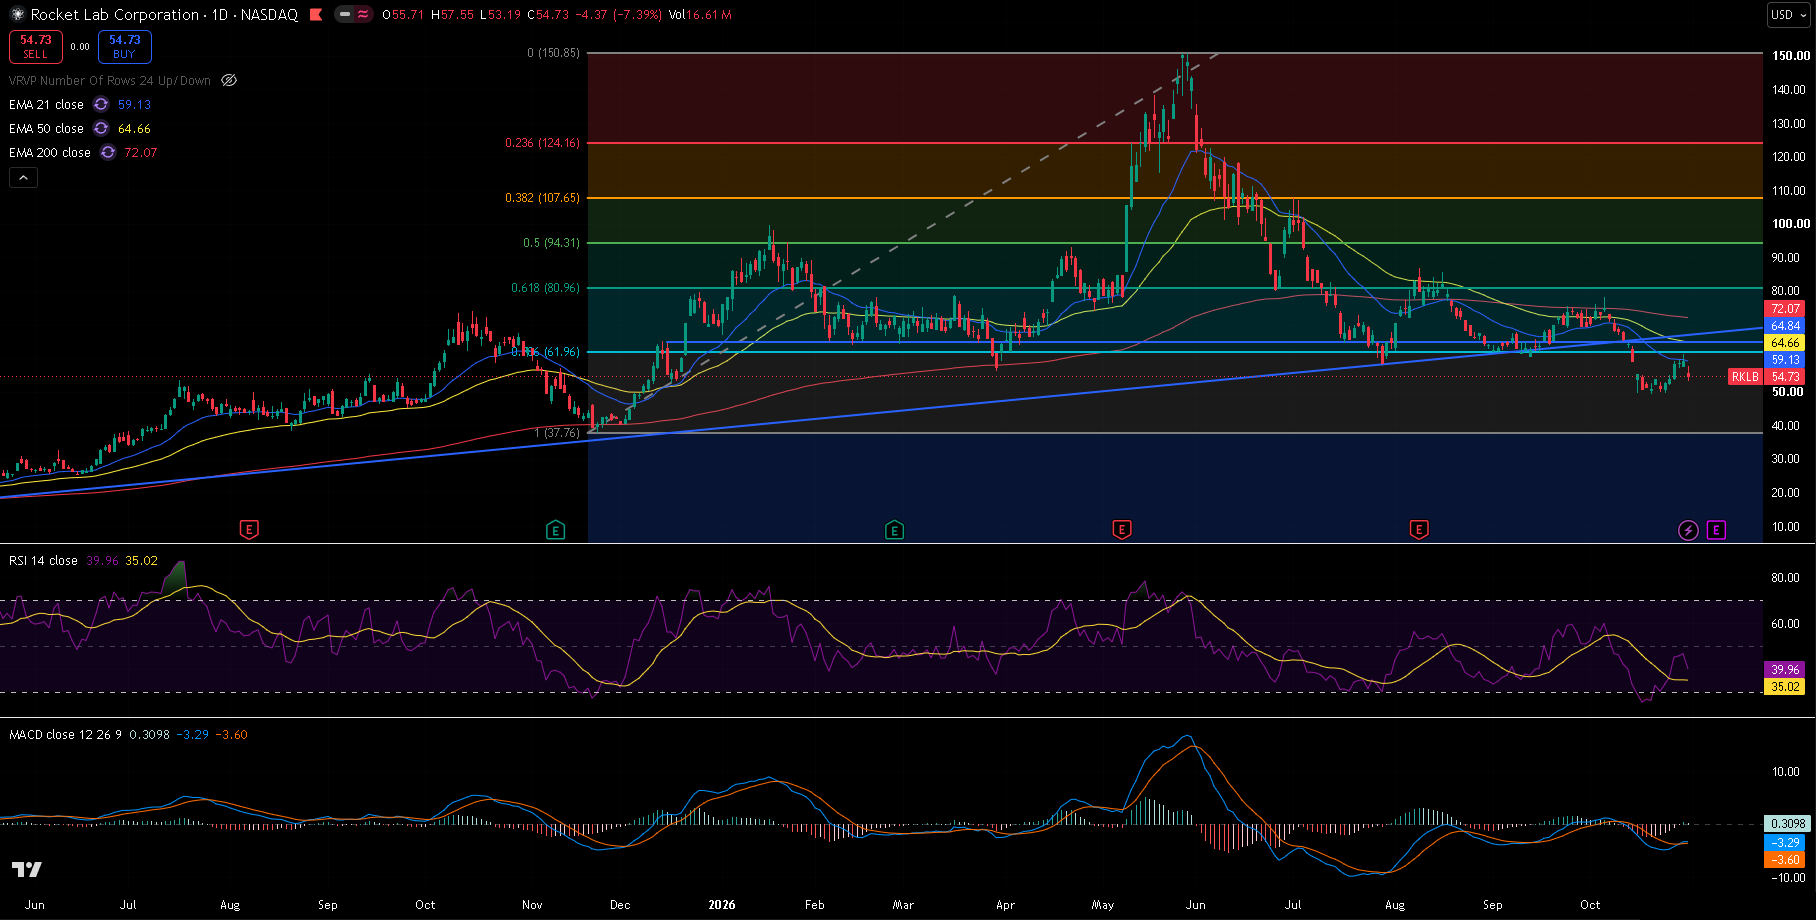
RKLB daily chart since mid-2025, 30 October 2026 close — 21/50/200 EMA, RSI(14) with its moving average, MACD(12,26,9), the Fibonacci retracement of the November 2025 to May 2026 rally, the 64.84 level and the rising trendline from April 2025. Price is now below the 78.6% level and the trendline.
Trend and Structure
Rocket Lab quadrupled from 37.76 in November 2025 to 151.00 on 27 May, then gave most of it back. The rising trendline from April 2025 held through the summer but broke in October, and the slide reached 49.25 on 20 October. Last week's rebound to 61.13 failed right where it should have — under the 78.6% level at 61.96 and below the broken trendline and the 64.84 line. The EMAs are stacked bearishly: 21 (59.13) under 50 (64.66) under 200 (72.07).
Key Levels
The level that matters most is the 20 October low at 49.25. Overhead, 61–66 — last week's high, the 78.6% level, the 64.84 line, the 50 EMA and the broken trendline — is a thick band of resistance.
| Type | Level | Why it matters |
|---|---|---|
| Fib 61.8% | 80.96 | Retracement of the November–May rally |
| EMA 200 | 72.07 | Long-term trend |
| Trendline | ~66 | Rising trendline from April 2025, broken in October |
| Resistance | 64.84 | Horizontal level on the chart |
| EMA 50 | 64.66 | Medium-term trend |
| Fib 78.6% | 61.96 | Deepest retracement before the rally is fully undone |
| Resistance | 61.13 | 29 October high, where the bounce stalled |
| EMA 21 | 59.13 | Short-term trend |
| Current | 54.73 | Last close |
| Support | 53.19 | Friday's low |
| Support | 49.25 | 20 October low |
| Support | 39.98 | 1 December 2025 low |
| Support | 37.76 | November 2025 low, start of the rally |
Fibonacci levels are drawn from the November 2025 low at 37.76 to the May 2026 high near 150.85. The trendline level is approximate and read from the chart.
Momentum and Volume
RSI(14) is at 39.96, above its own average of 35.02 after the late-October bounce. MACD is at -3.29 against a signal line of -3.60, a histogram of +0.31: a bullish crossover below zero, but Friday's drop is testing it. Friday's 16.6 million shares was a little below the 20-day average of about 19.6 million.
Bull Case
The 49–53 area holds and price closes above the 78.6% level at 61.96. That would open the 64.84 line and the 50 EMA, with the broken trendline near 66 and the 200 EMA at 72.07 above.
Bear Case
A daily close below the 20 October low at 49.25 makes a new low for the move. With the Fibonacci levels all broken, the December and November 2025 lows at 39.98 and 37.76 are the next supports on the chart.
Trade Scenarios
| Direction | Trigger | Stop | Target |
|---|---|---|---|
| Long | Daily close above 61.96 | 53.00 | 64.84, then 72.07 |
| Short | Daily close below 49.25 | 58.00 | 39.98, then 37.76 |
Risk warning: Technical analysis reflects probability, not certainty. Levels are reference points, not signals. Capital at risk. This is educational content, not investment advice.